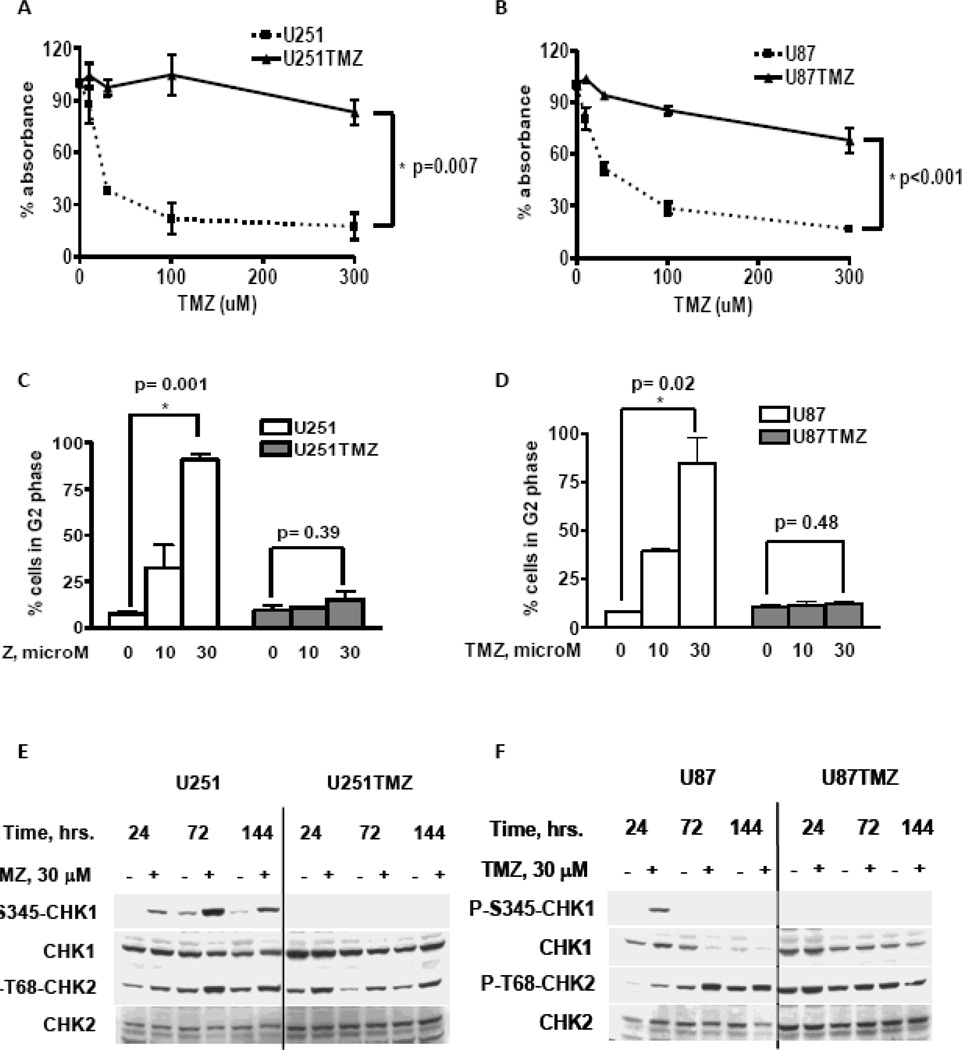
Figure 1.
Characterization of TMZ resistant GBM cell lines. (A–B) The indicated cell lines were plated in triplicates and exposed to graded concentrations of TMZ. After incubation for 144 hours, cell survival was quantified using the CyQuant colorimetric assay. The mean relative absorbance ± SE from two independent experiments is presented. (C–D) Cells treated with or without 30 microM TMZ were fixed at 72 hours and analyzed for cell cycle distribution by flow cytometric analysis of cellular DNA content. The percent of cells in G2/M (mean ± SEM from three independent experiments is presented. (E) Cells treated with or without TMZ were harvested at indicated time points, and phosphorylation and total levels of Chk1 and Chk2 were analyzed by western blot. Representative results from 3 independent experiments are shown.

