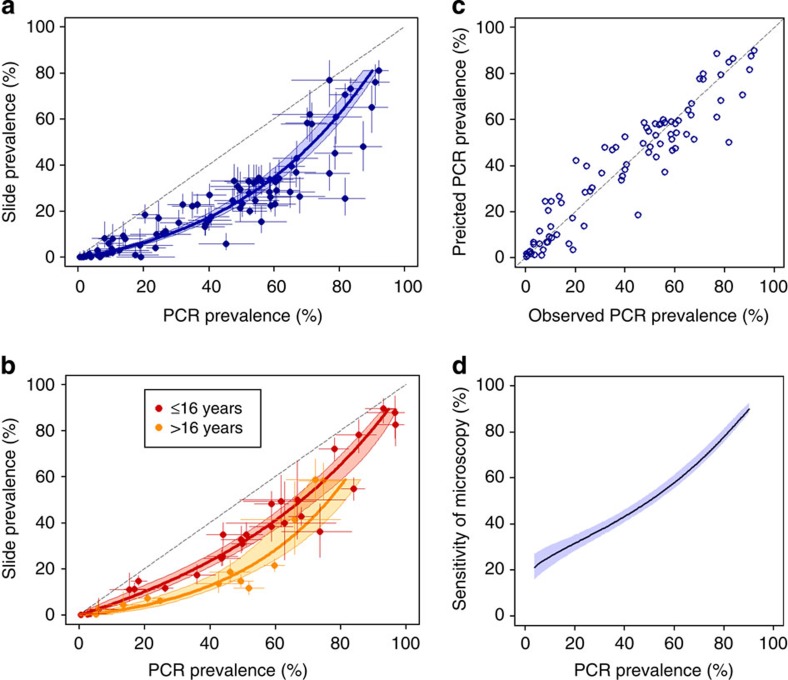
Figure 1. Prevalence of infection by PCR versus microscopy in 106 prevalence surveys and model fits.
Bayesian Markov chain Monte Carlo methods were used in model fitting to allow for measurement error in both microscopy and PCR prevalence measures50. Posterior medians are shown. (a) Prevalence data with 95% CI from 86 surveys containing both adults and children, and fitted model (blue line) with 95% credible interval of the mean (light blue area). The model fitted was a linear relationship on the log odds scale. (b) Age-specific prevalence with 95% CI for survey data containing children only (<16 years, red dots, n=28) or adults only (≥16 years, orange dots, n=13). Fitted models (lines) with 95% CI (shaded areas) were obtained using the same methods as in a. (c) Correlation between observed and model-predicted PCR prevalence in the all-age surveys (a), obtained using leave-one-out cross-validation. Correlation coefficient=0.941. (d) Estimated average sensitivity of microscopy and 95% credible interval of the mean in the all-age surveys according to underlying PCR prevalence.

