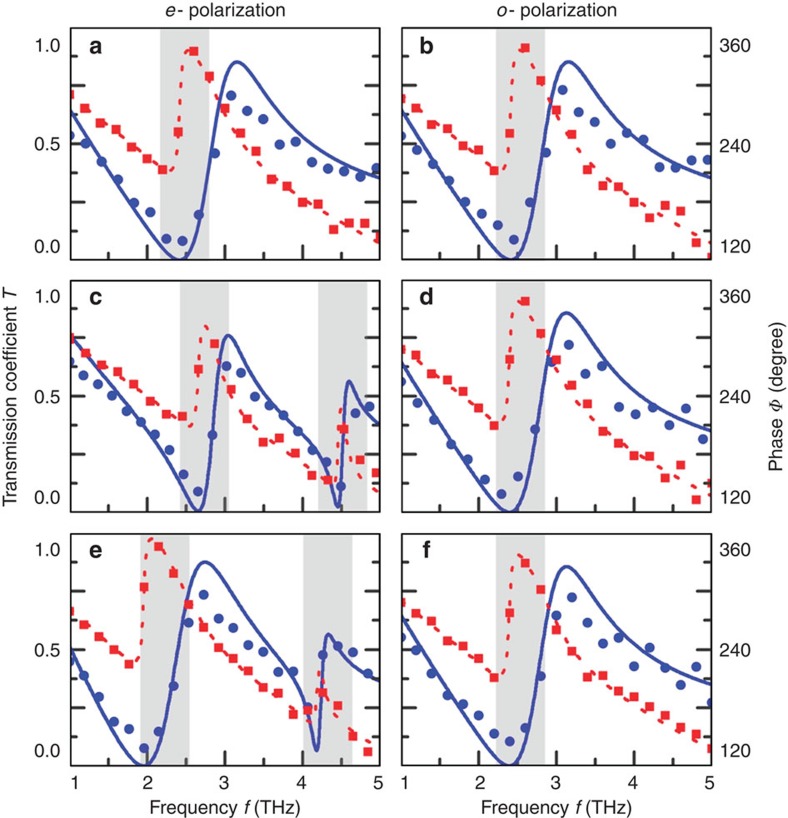
Figure 3. Measured transmission and phase spectra of the Maltese-cross metamaterial.
The first and second columns represent e- and o-polarized incident light, respectively. The blue solid lines and circular symbols show the numerical and experimental analyses of the transmission, respectively. The red dotted line and square symbols show the numerical and experimental analyses of the phase, respectively. The first, second and third rows show the spectra, when the shift distance is S=0 μm (a,b), 2.5 μm (c,d) and 5 μm (e,f), respectively. Rapid phase changes in the frequency domain are highlighted in gray.

