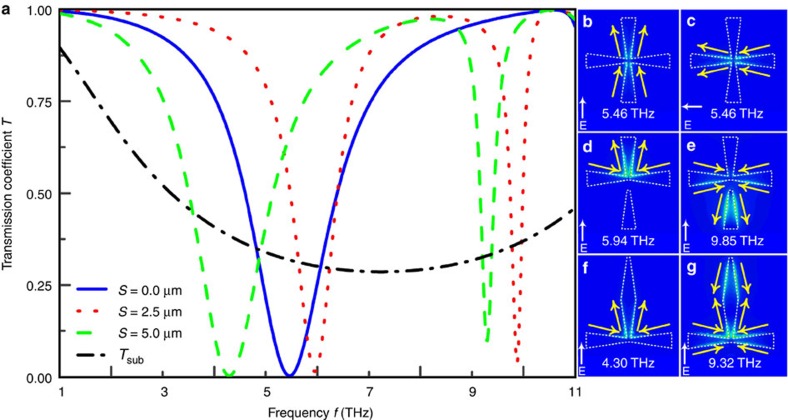
Figure 5. Transmission spectra at different shift distance and surface current contour maps of the Maltese cross without substrate.
(a) The solid, dotted and dashed lines represent the transmission spectra of the Maltese cross when the shift distance S is 0, 2.5 and 5 μm, respectively. The transmission of the 3-μm substrate is represented by the black dash dotted line. (b–g) The contour maps show surface currents under excitation by different frequencies of light. The lighter colour shows the high density of surface current, and the arrows show the surface current flux direction. The direction of the incident electric field is marked with the white arrow at the lower left corner. The direction of the surface current is marked with the yellow arrow.

