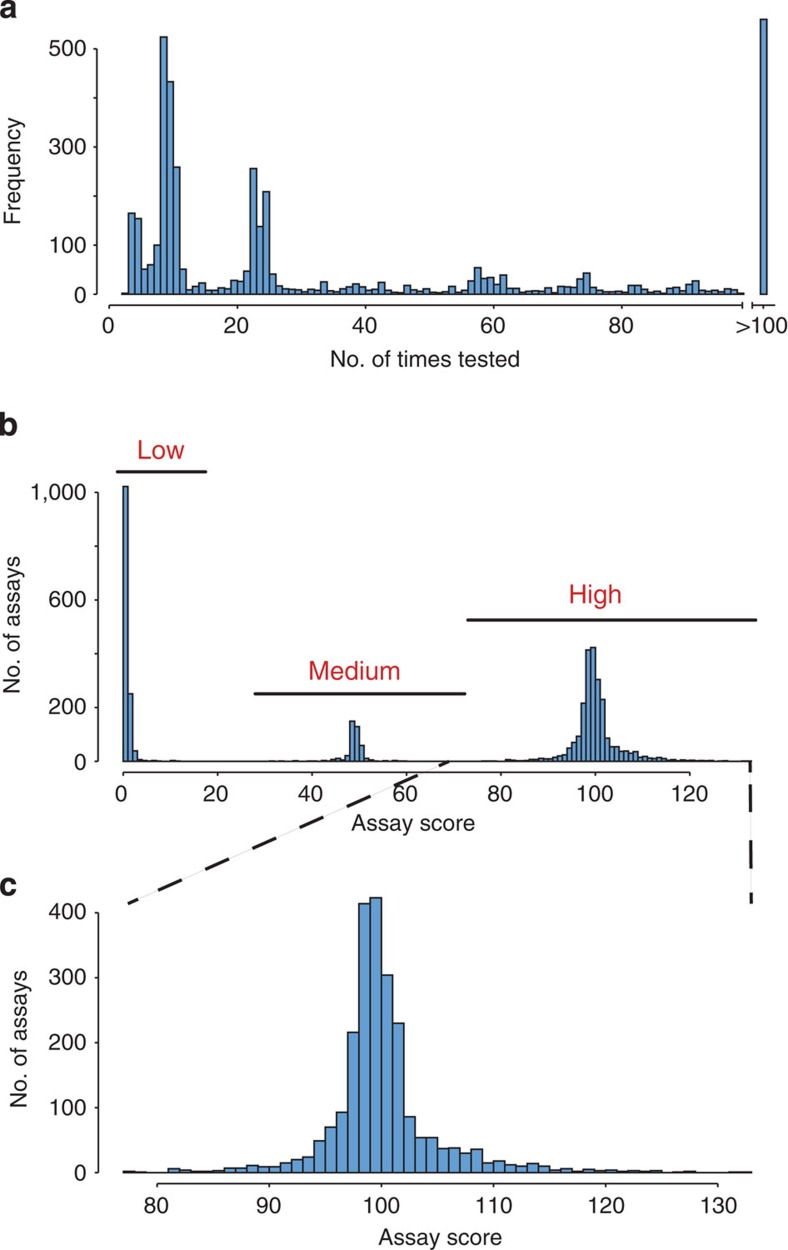
Figure 2. Rule-based assay score modelling can select high performing assays depending on cellular compartment and cellular state.
SRM assays were tested repeatedly in mixtures of GAS tryptic digests from different sub-cellular compartments and bacterial states. (a) Statistics over the repetitive testing of all SRM assays. The y-axis shows the frequency of the number of times a SRM assay was tested. (b) The assays were divided up into three categories, low-, medium- and high-scoring SRM assays based on a rule-based assay score model. In summary, the higher the frequency with which an SRM assay was observed with high probability, the higher the assay score. (c) Assay score distribution for high-scoring SRM assays.

