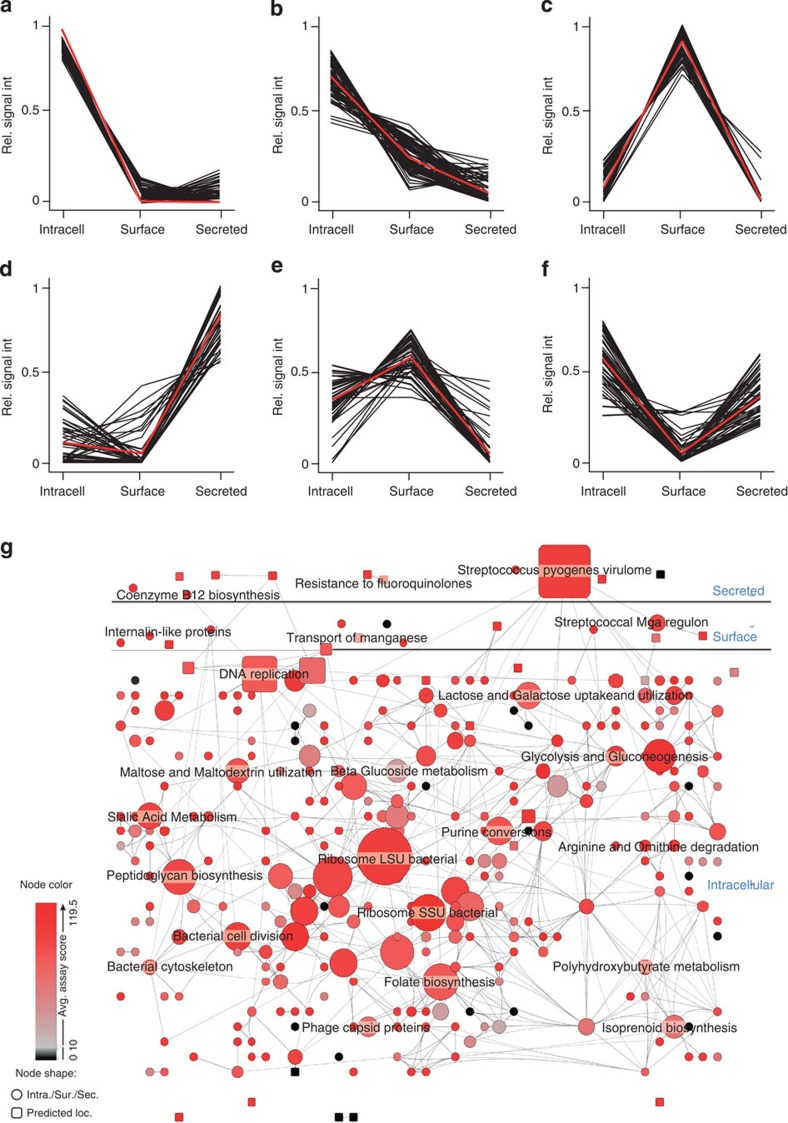
Figure 4. Spatial distribution of proteins with high-scoring SRM assays.
Testing of all SRM assays in three sub-cellular compartments enabled the construction of a sub-cellular distribution map for the proteins with high-scoring assays. By using k-mean clustering, the expression profiles were split into six different clusters: (a,b) predominately intracellular proteins, (c) surface-associated proteins, (d) secreted proteins and (e,f) proteins with split sub-cellular compartmentalization. Black lines in a–f represent the relative protein compartment signal and the red lines represent the average distribution of the clusters. Subsequently the identified proteins were grouped into NMPDR sub-systems and visualized using Cytoscape. (g) Outline of the GAS proteome network topology, where circles represent NMPDR sub-systems where all proteins predominantly have the same sub-cellular location, secreted, surface-associated or intracellular, according to the sub-cellular protein profiles in (a,d). Rectangles represent NMPDR sub-systems where an equal number of members have opposing sub-cellular location profiles. The localization of the rectangles in the network is influenced by the edges, which represent protein members that belong to more than one NMPDR sub-system. Increasing node size represents increasing number of member proteins. The colour represents average SRM assay score, where red indicates NMPDR sub-systems with high-average SRM assay score and black indicating NMPDR sub-systems with low average SRM assays score. For full details of NMPDR sub-systems see Supplementary Fig. S1.

