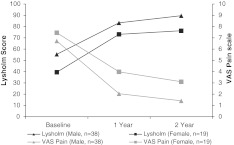
Fig. 4.
Effect of sex on clinical outcome evaluated by the Lysholm and VAS score. Mean scores at baseline and at 1 and 2-year follow-up are shown. Between-group differences of mean improvement from baseline for Lysholm (female: 36.8 ± 25.9; male: 34.3 ± 15.7, p = 0.416) and VAS (female: 4.0 ± 2.3; male: 5.1 ± 2.8, p = 0.047) were not significant

