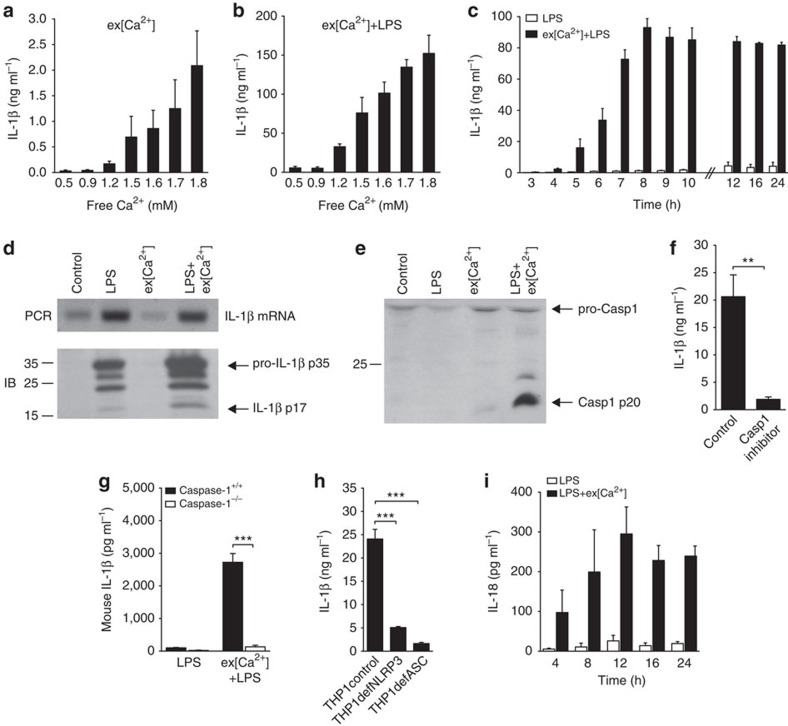
Figure 1. Extracellular calcium induces monocyte IL-1β release by activating the inflammasome.
(a,b) IL-1β release of CD14+ monocytes in response to increasing ex[Ca2+] alone (a) or to increasing ex[Ca2+] plus LPS (b) after 16 h of stimulation (n=3). (c) time course of IL-1β release of CD14+ monocytes after stimulation with LPS alone or with increased ex[Ca2+] (1.7 mM) plus LPS (n=3). (d) PCR (upper panel) and immunoblot (IB, lower panel) for IL-1β in unstimulated monocytes (control) and in monocytes stimulated with LPS, with increased ex[Ca2+] concentration (1.7 mM), or both, after 16 h of culture. Specific bands for IL-1β mRNA, pro-IL-1β p35 and IL-1β p17 as indicated. One representative experiment out of three is shown. (e) IB analysis of Caspase-1, which shows the activation of Caspase-1 in supernatants harvested from unstimulated monocytes (control) and in monocytes stimulated with LPS, with increased ex[Ca2+] concentration (1.7 mM), or with both, after 16 h of culture. Specific bands for pro-Caspase-1 (pro-Casp1) and Caspase-1 (Casp1 p20) are indicated, shown is one representative blot out of three experiments performed. (f) IL-1β secretion of monocytes stimulated with ex[Ca2+] plus LPS in the absence and presence of the caspase-1 inhibitor Z-WEHD-FMK (5 μM, n=3). (g) mIL-1β secretion of monocytes from Caspase-1+/+ and Caspase-1−/− NOD mice stimulated with LPS or with ex[Ca2+] plus LPS (n=3). (h) IL-1β secretion of THP-1 cells (control), NLRP3-deficient THP-1 cells (THP1defNLRP3) and ASC-deficient THP-1 cells (THP1defASC) stimulated with increased ex[Ca2+] concentration (1.7 mM) and LPS, after 16 h of culture (n=3). (i) Time course of IL-18 release of CD14+ monocytes after stimulation with LPS alone or with increased ex[Ca2+] (1.7 mM) plus LPS (n=3). In all experiments, cytokine concentrations were determined in the supernatant by enzyme-linked immunosorbent assay. All bars show mean±s.e.m. Statistical analysis was performed using the two-tailed Student’s t-test; **P<0.01 and ***P<0.001.

