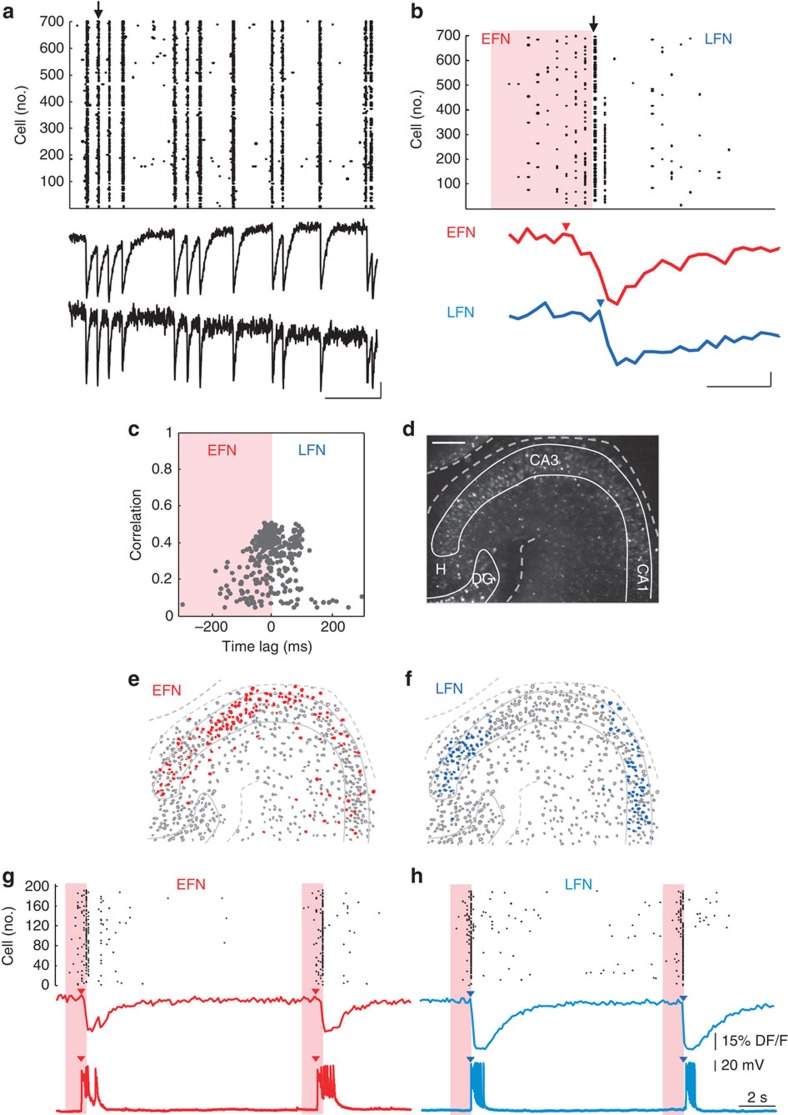
Figure 1. Spatio-temporal network dynamics in the absence of fast GABAergic transmission in the developing CA3 region.
(a) Top: Rasterplot of the calcium event onsets as a function of time for every neuron imaged in the presence of bicuculline (10 μM) in a P7 mouse hippocampal slice loaded with Fura-2AM and recorded with two-photon multibeam excitation at X10 magnification. Bottom traces show two representative calcium fluorescence traces from two cells in the network. Scale bar: x axis: 30 s, y axis: 10% DF/F. (b) Top: Rasterplot showing the temporal recruitment of the neurons involved in a representative network burst (marked by an arrow in (a)). Orange area indicates the time of activation of EFN while white area indicates that of LFN. Arrow indicates the peak of maximum cell coactivation. Two examples of calcium fluorescence changes occurring in an EFN (red) and a LFN (blue) during that event are illustrated below. Scale bar: x axis: 1 s, y axis: 10% DF/F. (c) Time-lag correlation graph plotting for each imaged neuron (729 neurons) the average correlation and average time of activation relative to all other cells for all network bursts within a recording session (12 events). The peak of maximum cell coactivation (arrow in b) was used as the zero time reference. (d) Two-photon calcium fluorescence image of the recorded network. Scale bar: 100 μm. (e) Contour plot of the cells imaged in (b). Red filled contours indicate EFNs. (f) Same as (e) with LFNs filled in blue. (g,h) Simultaneous calcium imaging and patch-clamp recording of EFNs (red, g) and LFNs (blue, h) in the CA3 region of a P7 mouse slice. Top rasterplots indicate the fraction of active cells as a function of time. In both cases, two network bursts were recorded. Arrows indicate the activation onsets of the EFN (red) and LFN (blue). Middle traces illustrate the calcium fluorescence changes in EFNs and LFNs and bottom traces show the simultaneous membrane potential changes recorded in current-clamp mode at resting membrane potential (I~0 pA) in the EFN (red) and LFN (blue).

