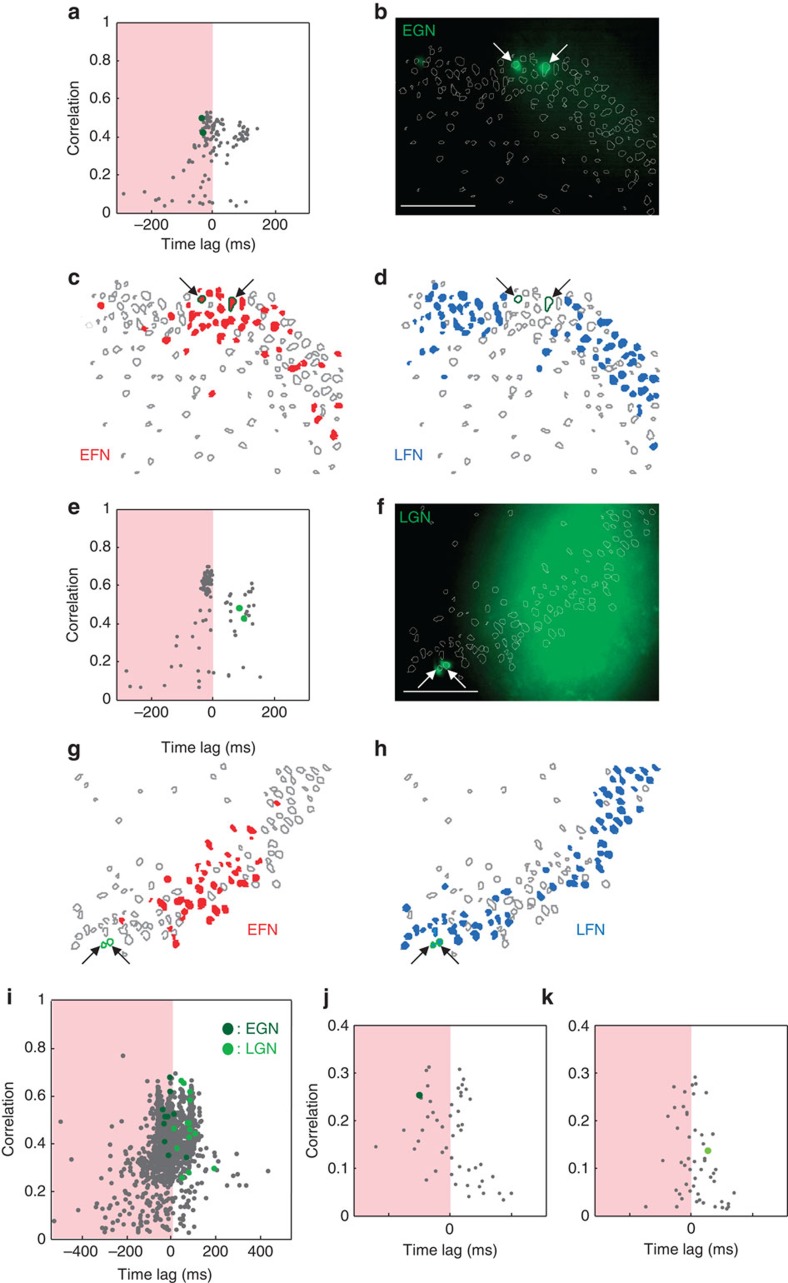
Figure 3. Glutamatergic neurons are differentially recruited in synchronization build-ups according to their age.
(a) Time-lag correlation graph plotting for each imaged neuron (grey points) the average correlation and average time of activation relative to all other cells for every network burst occurring, in the absence of fast GABAergic transmission, in the CA3 region of a P7 Ngn2CreERTM;RCE:LoxP mouse hippocampal slice (tamoxifen treated at E12). Dark green circles indicate GFP-positive early-generated neurons (EGN). Note that they are both located in the EFN region (orange). (b) Photomicrograph of the region analysed in (a). Arrows indicate the two GFP-positive EGNs. Scale bar, 100 μm. (c,d) Contour map plotting the spatial distribution of imaged neurons. EFNs are red filled contours. GFPpositive EGNs are outlined in dark green. (d) Same as (c) for blue-filled LFNs. (e–h) Same as (a–d) but in a P7 Ngn2CreERTM;RCE:LoxP mouse hippocampal slice (tamoxifen treated at E16). Light green circles indicate GFP-positive late generated neurons (LGN). (i) Pooled time correlation graph for all experiments in the absence of fast GABAergic transmission (n=12 movies). Dark green circles indicate EGNs while LGNs are marked in light green. (j) Same graph as (a) but in physiological conditions, recorded before the application of a GABAA-R antagonist. In this case, network synchronizations correspond to GDPs. The dark green circle marks the position of an EGN and indicates that this cell is firing at the GDP onset. (k) Same as (g) for a LGN neuron (light green) showing a late activation during GDPs.

