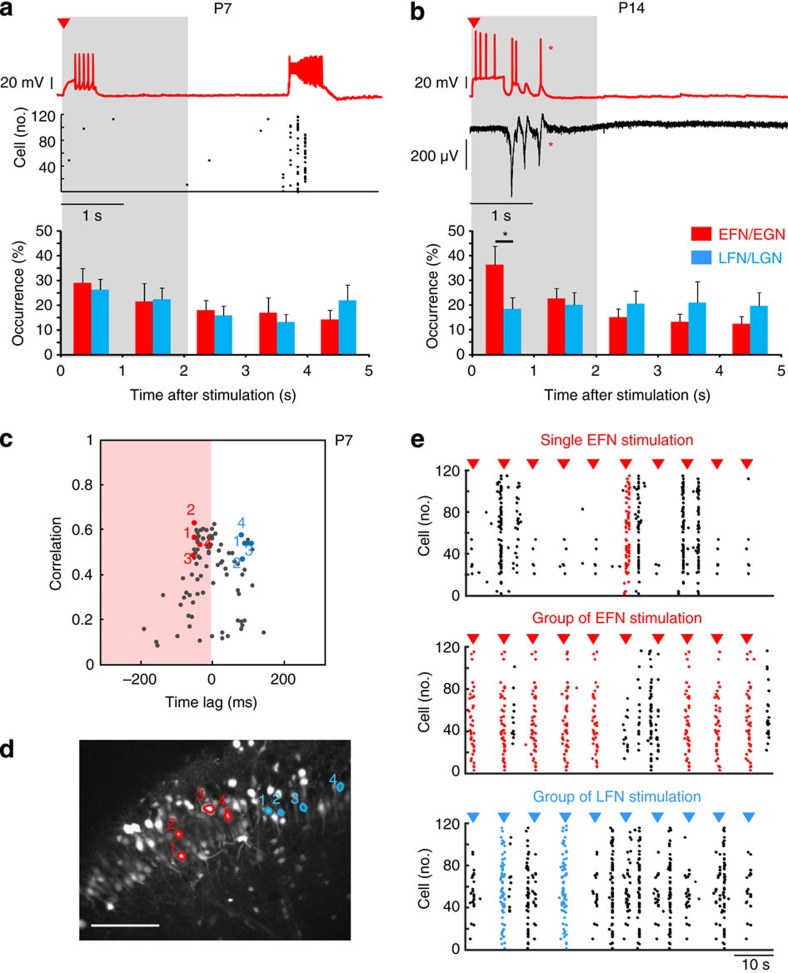
Figure 6. EGNs can trigger synchrony as small assemblies at P7 and single-handedly at juvenile stages.
(a,b) Simultaneous network and single-cell recordings of EFNs at P7 (a) and EGNs at P14 (b). Top Cells were recorded in current-clamp at resting membrane potential and stimulated with suprathreshold current injections (arrow head indicates stimulation). Middle Network activity was simultaneously recorded using calcium imaging at P7 (a rasterplot of cell activation as a function of time), or extracellular electrodes at P4 (b). At P15 single-cell stimulation triggers network bursts (marked by *). Bottom: Pooled data histograms plotting the averaged distribution of network bursts within a 5 s time window following stimulation of a single EFN/EGN (red) or LFN/LGN (blue) (n=19 EFN/9 EGN, n=22 LFN/12 LGN). Asterisks mark time interval when the occurrence of network bursts is significantly different following the stimulation of single EGN or LGN (P<0.05, Student t-test). Error bars are s.e.m. (c) Time correlation graph obtained from the analysis of a movie taken in the absence of fast GABAergic transmission in the CA3 region of a P7 mouse slice. Coloured points in the graph indicate the four-stimulated EFNs (red) and LFNs (blue). (d) Calcium fluorescence image of the recorded region. Outlined contours indicate the location of the four-stimulated EFNs (red) and LFNs (blue). Scale: 100 μm. (e) Rasterplots of cell activation as a function of time in the presence of bicuculline (10 μM) and 4-methoxy-7-nitroindolinyl-caged L-glutamate (200 μM), during stimulation of one single EFN (top), during stimulation of the four EFNs (middle), and during stimulation of the four LFNs (bottom). The arrowheads indicate the times of light stimulation (10 stimulations in each case). Network bursts that were time-locked to light stimulations are highlighted in colour.

