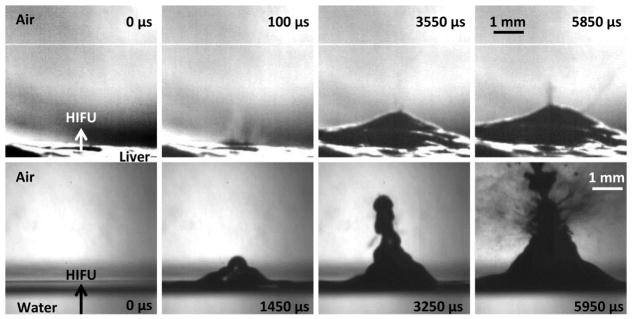
Figure 6.
A direct comparison of liver (upper) and water (lower) at intensities slightly above their respective atomization thresholds (8100 W/cm2 derated for liver and 550 W/cm2 for water). In both cases, the first frame occurs 20 μs after the ultrasonic wave arrives at the interface. The second shows the initial spray of atomization in liver (upper) and the mound forming in water (lower) with no atomization. The third frame shows the small spray of atomization from the mound in liver and the first case of atomization for water; whereas the final frame shows atomization at its most significant. The timing is fairly similar between liver and water; the only difference is that liver has that first initial spray of atomization before the mound forms and enhances atomization, while at this intensity water forms the mound before atomization occurs. In both cases, the total HIFU-on time was 10 ms. This figure is available as a movie in supplement 2.

