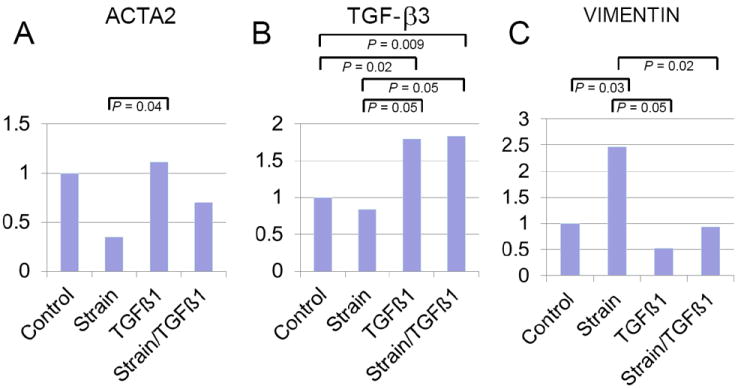
Figure 5.

Gene expression of ACTA2 (A), TGFβ3 (B), and vimentin (C) under static control conditions (n = 7), under biaxial cyclic strain alone (n = 5), with TGFβ1 alone (n = 8), and treated with both strain and TGFβ1 (n = 8). Data was normalized to GAPDH and expressed as fold difference from control. Bars denote statistically significant comparisons.
