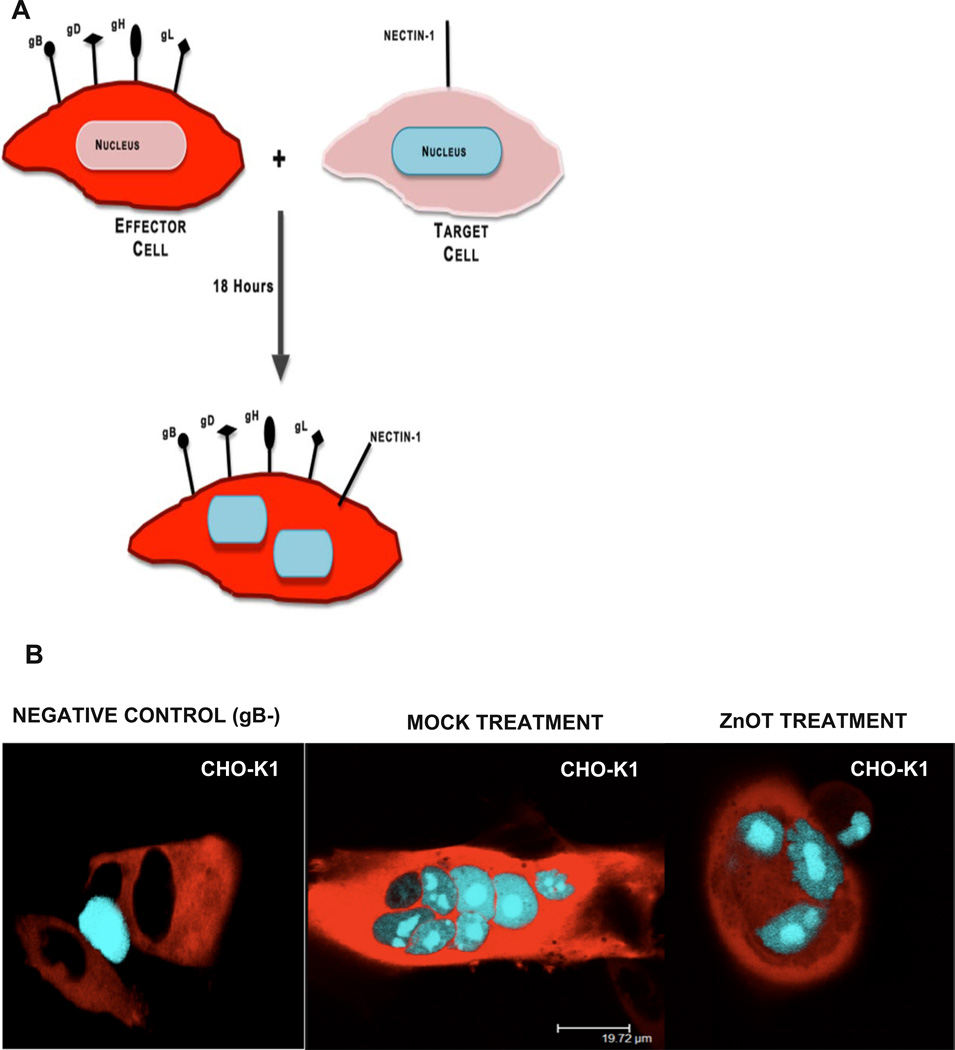
FIGURE 8. An illustration of red-blue syncytia assay used to understand the effect of ZnOT treatment.
Effector cells expressing HSV-2 glycoproteins required for entry and NES-RFP signal were mixed with target cells expressing gD receptor nectin-1 and CFP-NLS signal. Effectors were pretreated with ZnOT prior to the mixing of target and effector cells. (B) Using a confocal microscope syncytia formation was recorded 24hours post mixing.

