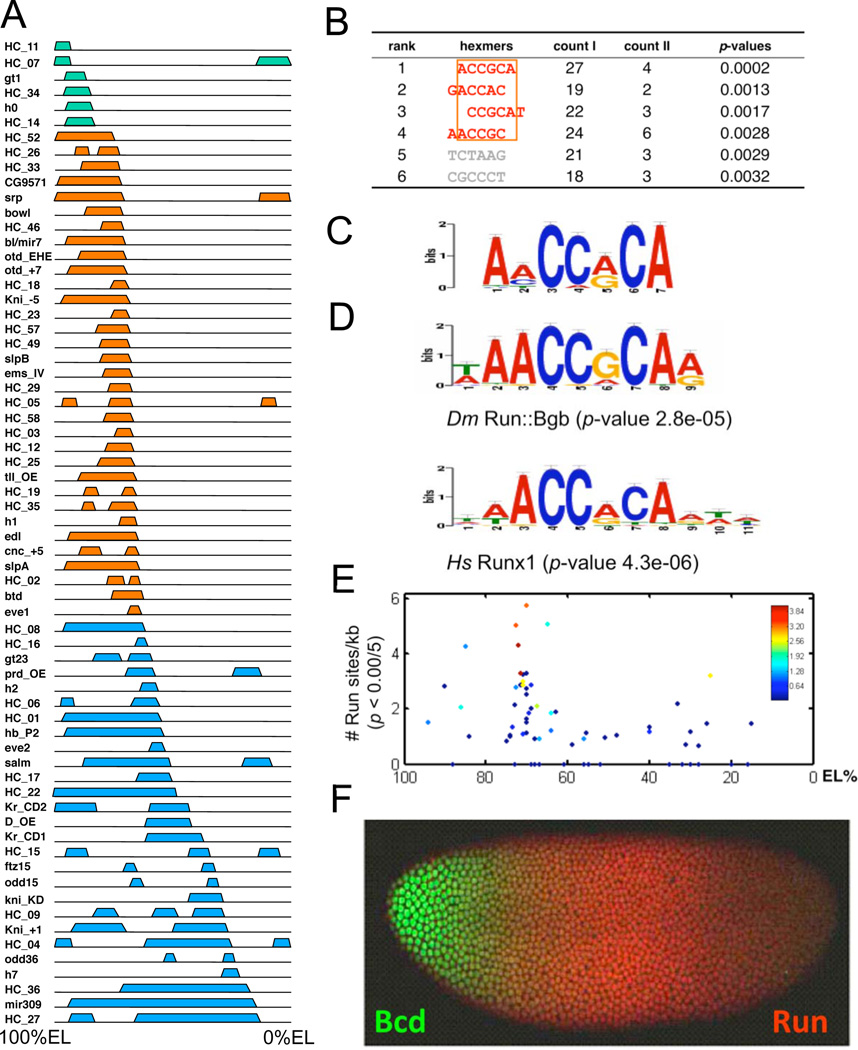
Figure 2. Over-represented Run-binding sites in Type I enhancers.
(A). Schematics of expression patterns driven by 66 known Bcd-dependent enhancers. Colored blocks above each line show the expression patterns driven by individual enhancers in early NC14 embryos. The left end of each line represents the anterior tip of the embryo (100%EL). The enhancers are classified by the positions of their Bcd-dependent posterior boundaries (see text). Type 0 is in green, Type I in orange, and Type II in blue. (B). Actual counts of specific hexamers in Type I and Type II enhancers. p-values were calculated using an exact binomial test (Experimental Procedures). The top four over-represented hexamers can be aligned (orange rectangle). (C). Motif derived from Type I enhancers using a discriminative MEME algorithm and the Type II sequences as negative filter(Bailey et al., 2010). This motif is very similar to Runt domain transcription factor binding motifs Drosophila Runt and human Runx1 (D). P-values were determined by the TOMTOM program(Gupta et al., 2007). (E). Correlation between Run-binding site number (y-axis) and posterior boundary position (x-axis) for all Bcd dependent enhancers. Each enhancer is represented by a single diamond, and aggregate binding strength (estimated by the STUBB algorithm) is represented by the color of each diamond according to the heat map shown. (F). Bcd and Run protein expression patterns in an early NC14 embryo.

