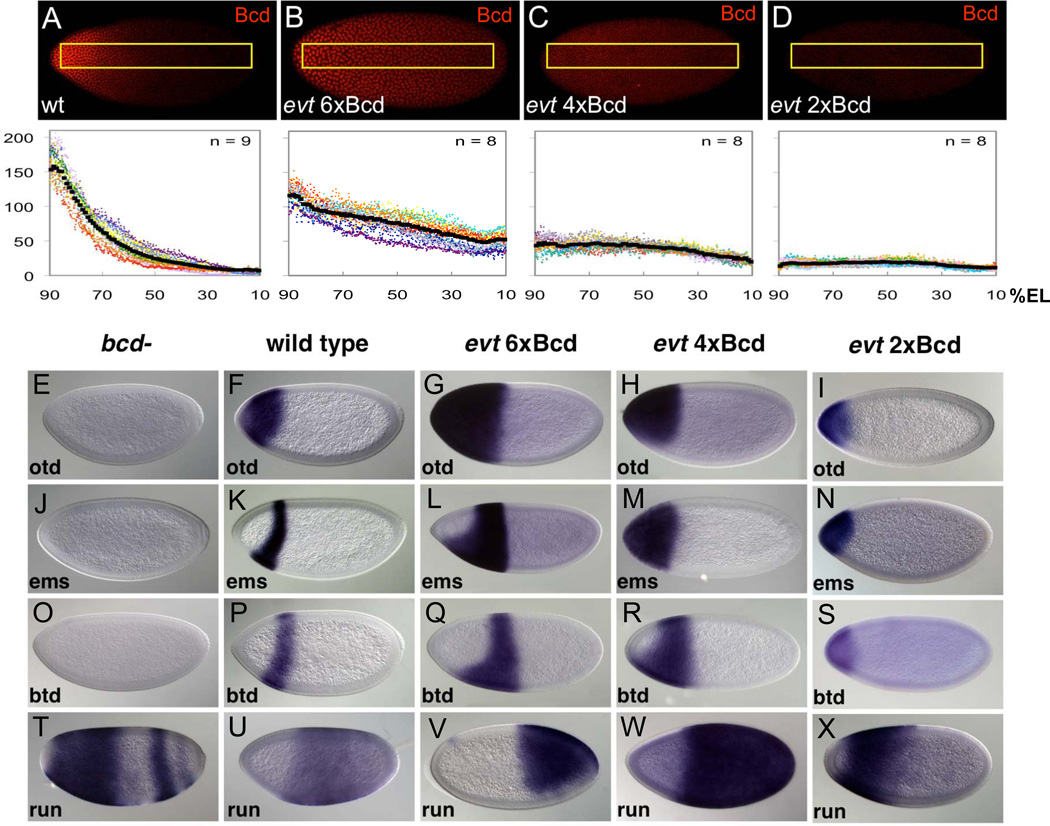
Figure 6. Boundary positioning in embryos with flattened Bcd gradients.
(A–D). Bcd gradient profiles in wild type embryos (A) and exu vas tor (evt) triple mutant embryos with six (B), four (C) or two copies (D) of bcd. Boxes in top panels represent regions used for quantification (bottom panels: Y Axis = raw intensities). Each color represents data extracted from a single embryo. Mean expression profiles for each expression pattern (Experimental Procedures) are depicted by black lines. (E–X). An exu vas tor (evt) triple mutant chromosome was used to make embryos with flattened Bcd gradients, and bcd copy numbers were varied to provide different levels of Bcd. Individual genes assayed are indicated on each panel.

