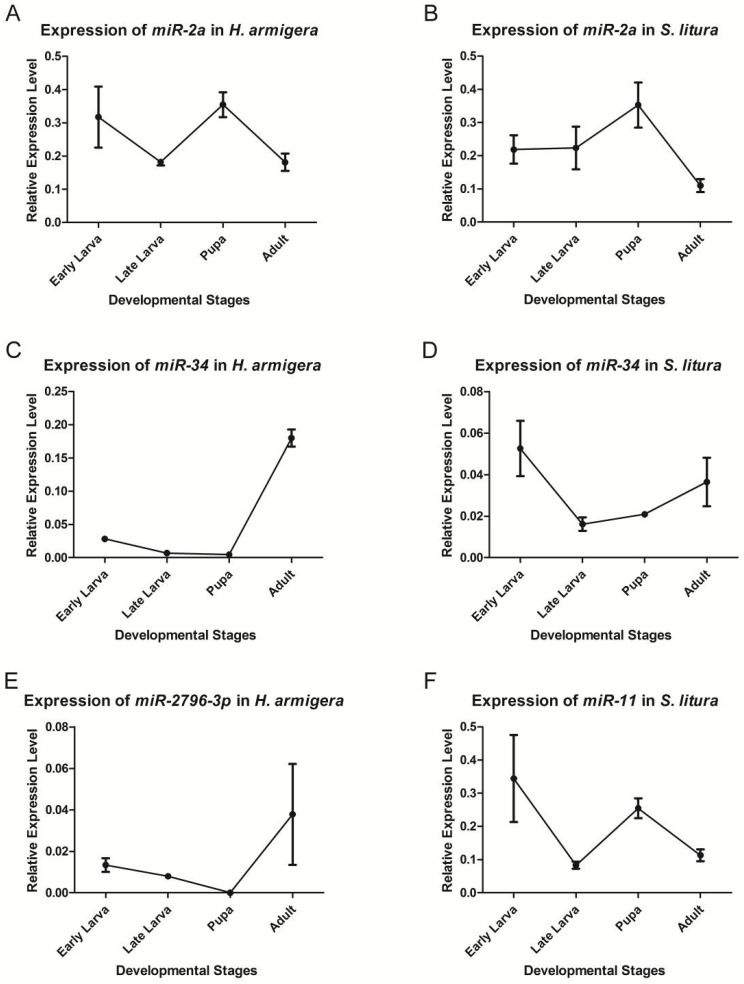
Figure 4.
Expression levels of miRNAs at different developmental stages. qRT-PCR was used to analyze the expression levels of miR-2a (A, B), miR-34 (C, D), har-miR-2796-3p (E) and sli-miR-11 (F). The transcript levels were calculated relative to the amount of U6 after normalization. 3 technical replications were performed. The values are the average±SD of the 3 repeats.

