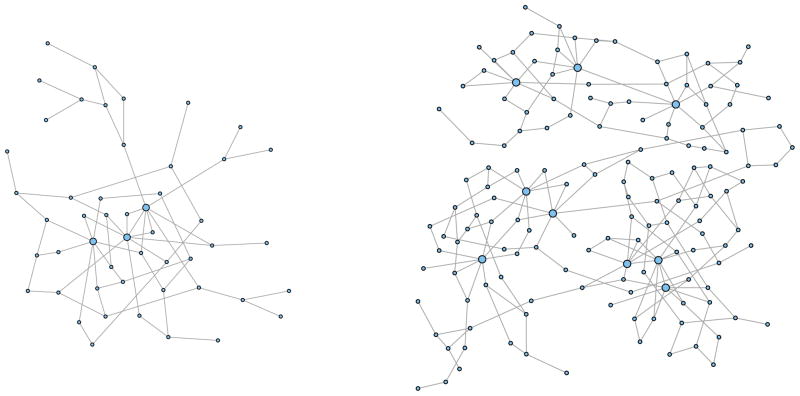
Figure 1.
Examples of the simulated network graphs: the graph on the left is used in the first set of simulations (single module) and has 50 nodes including 3 hub nodes with around 70 edges; the graph on the right is used in the second set of simulations (triple modules) and has 150 nodes including 9 hub nodes with around 210 edges.

