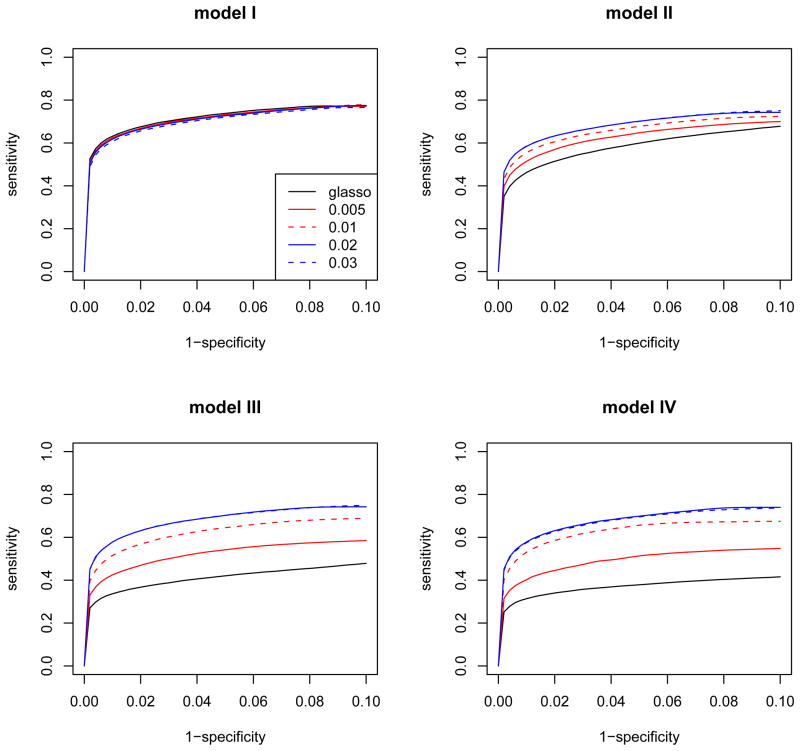
Figure 3.
The ROC curves of glasso and the robust method with different robustness tuning parameters, β = 0.005, 0.01, 0.02, and 0.03 for the second set of simulations with p = 150, n = 100. Model I does not have outliers, but Model II, III and IV has 10% of small, medium and large magnitudes of outliers, respectively. Each curve is an average over 100 simulated data sets.

