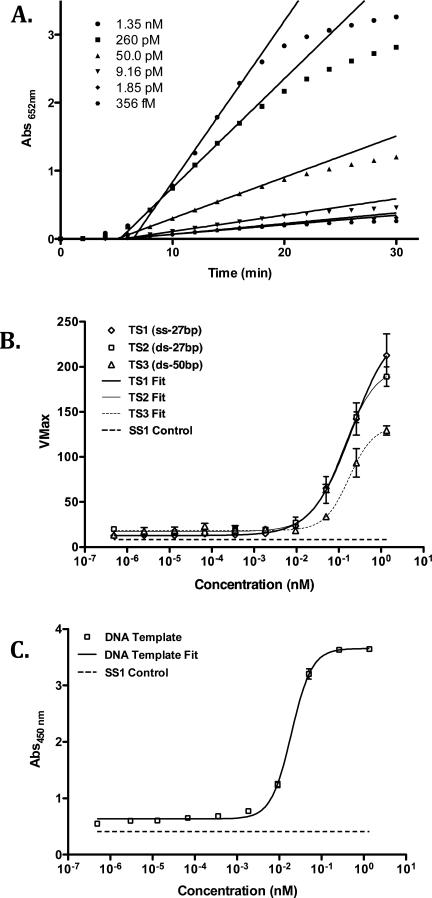
Figure 4.
Detection of DNA using PNA probes SP1 and RP1. A. Absorbance data (652 nm) for detection of TS1 DNA over a range of concentrations and linear regression analyses of maximum velocities (VMax) for each concentration. B. Signal response plot (VMax vs. [DNA]) for each DNA in Table 2 and curve fits for each plot. C. Signal response plot (Absorbance at 450 nm vs. [TS1 DNA]) obtained after quenching of enzymatic oxidation with H2SO4.

