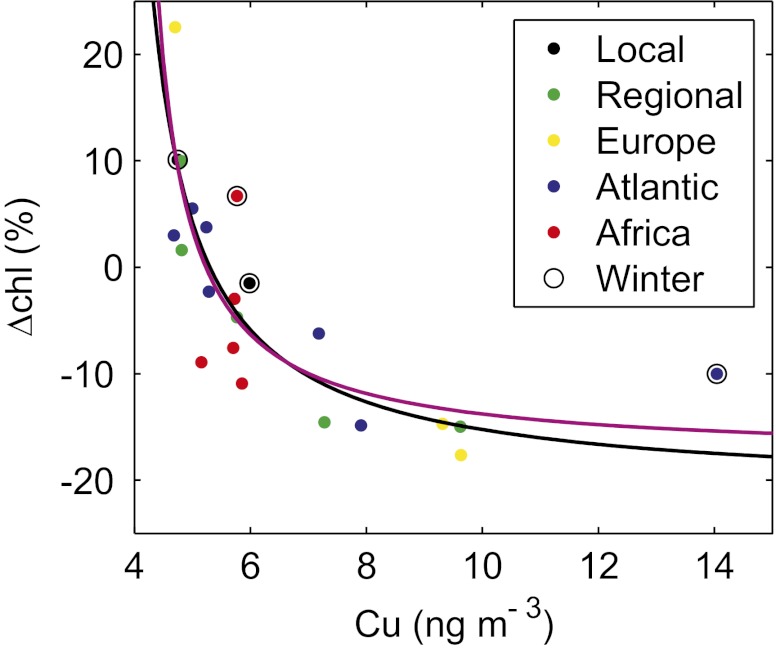
Fig. 2.
Observed effect of Cu aerosol pulses on satellite daily chlorophyll variation (ΔChl) averaged in the 3.5 × 3.5° box area (Fig. 1). The dots represent the spatially averaged ΔChl (%) for each Cu pulse, the various colors indicate the aerosol sources, and the open circles are the Cu pulses during winter (December to March). The lines are the regression of the observed values with (magenta line) and without (black line) African aerosols to Eq. 5 using a nonlinear least-squares method.

