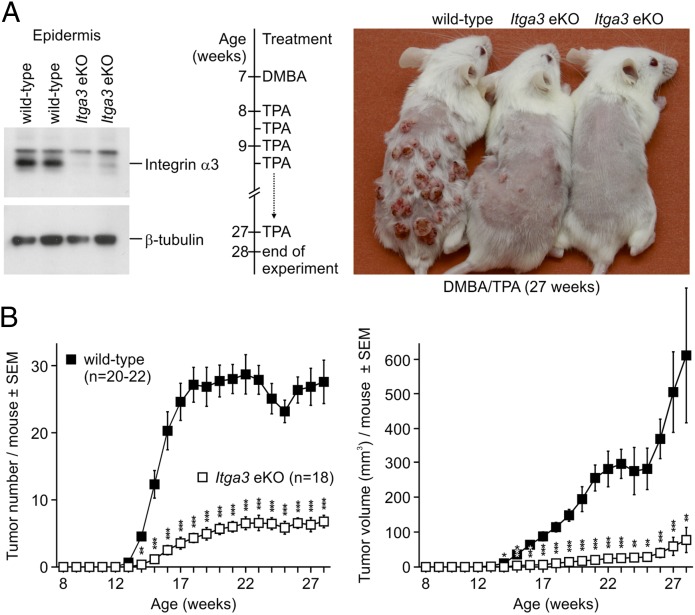
Fig. 1.
Impaired skin carcinogenesis of Itga3 eKO mice. (A) From left to right: Western blot showing the absence of α3 in the epidermis of Itga3 eKO mice, timeline of the applied two-stage skin carcinogenesis protocol, and macroscopic image of three littermates at the end of the experiment. (B) Tumor number and volume are significantly diminished in Itga3 eKO mice compared with those in WT littermates after DMBA/TPA-induced skin carcinogenesis (*P < 0.05, **P < 0.01, ***P < 0.001).

