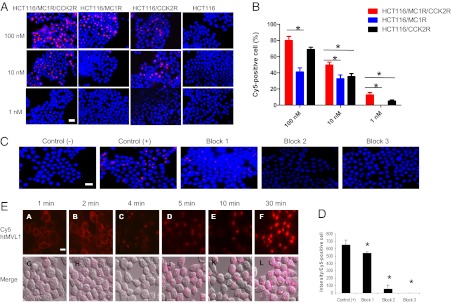
Fig. 2.
Live cell imaging of Cy5 htMVL 1 specifically binding to target cells. (A) Four types of cells were treated with htMVL 1 at the indicated concentrations for 15 min. Representative live cell fluorescence images of htMVL 1 binding are shown. Red, Cy5; blue, Hoechest. (B) The percentage of Cy5-positive cells was determined after htMVL 1 treatments in the target cells (red bars) and control cells (black and blue bars). The data are the mean ± SEM (n = 3). A total of ∼800 cells were counted for each condition. (C) Representative images of blocking study conducted in the target cells. Control (-), no htMVL 1 treatment; Control (+), 10 nM htMVL 1; Block 1: 10 nM htMVL 1 + 10 µM NDP-α-MSH; Block 2: 10 nM htMVL 1 + 10 µM CCK8; Block 3: 10 nM htMVL 1 + 10 µM CCK8 + 10 µM NDP-α-MSH. (D) A total of ∼600 cells were counted for each condition. The data are shown as mean ± SEM (n = 3), *P < 0.05. (E) htMVL 1 ligand was processed and internalized over time after incubation in the target cells. (A–F) Cy5 fluorescence images (red). (G–L) Cy5 fluorescence images merged with a visible light image. (Scale bars: 25 µm.)

