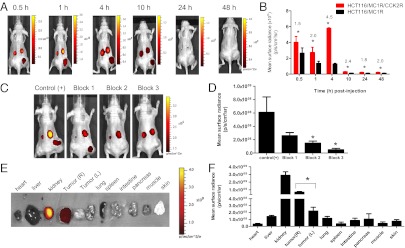
Fig. 3.
In vivo fluorescence imaging of Cy5 htMVL 1 specifically retained in target tumors. (A) Representative time course of fluorescence images of the Cy5 htMVL 1 retained in mice bearing xenograft tumors. R flank, target tumor; L flank, control tumor (MC1R control). (B) Mean surface radiance of htMVL 1 (2.5 nmol per mouse) in the target tumors (red bars) and control tumors (black bars) was quantified at the indicated postinjection time points. Fold increase of mean surface radiance in target relative to control tumors (number shown above asterisks) is shown. Error is expressed as SEM (n = 4). (C) Representative images of blocking experiments. Control (+) (n = 4): 2.5 nmol htMVL 1 per mouse; Block 1 (n = 3): 2.5 nmol htMVL 1 + 50 nmol NDP-α-MSH; Block 2 (n = 5): 2.5 nmol htMVL 1 + 50 nmol CCK8; Block 3 (n = 3): 2.5 nmol htMVL 1 + 50 nmol CCK8 + 50 nmol NDP-α-MSH. (D) Mean surface radiance for each target tumor (R flank) under each condition. Error is reported as SEM. Block 2 and block 3 agents lead to significantly decreased signal compared with control tumors (without blocking). (E) Representative ex vivo image of tumors and organs excised 4 h after injection of 2.5 nmol htMVL 1. Tumor (R): target tumor; Tumor (L): control tumor. (F) Mean surface radiance for each organ. Error is expressed as SEM (n = 6), *P < 0.05.

