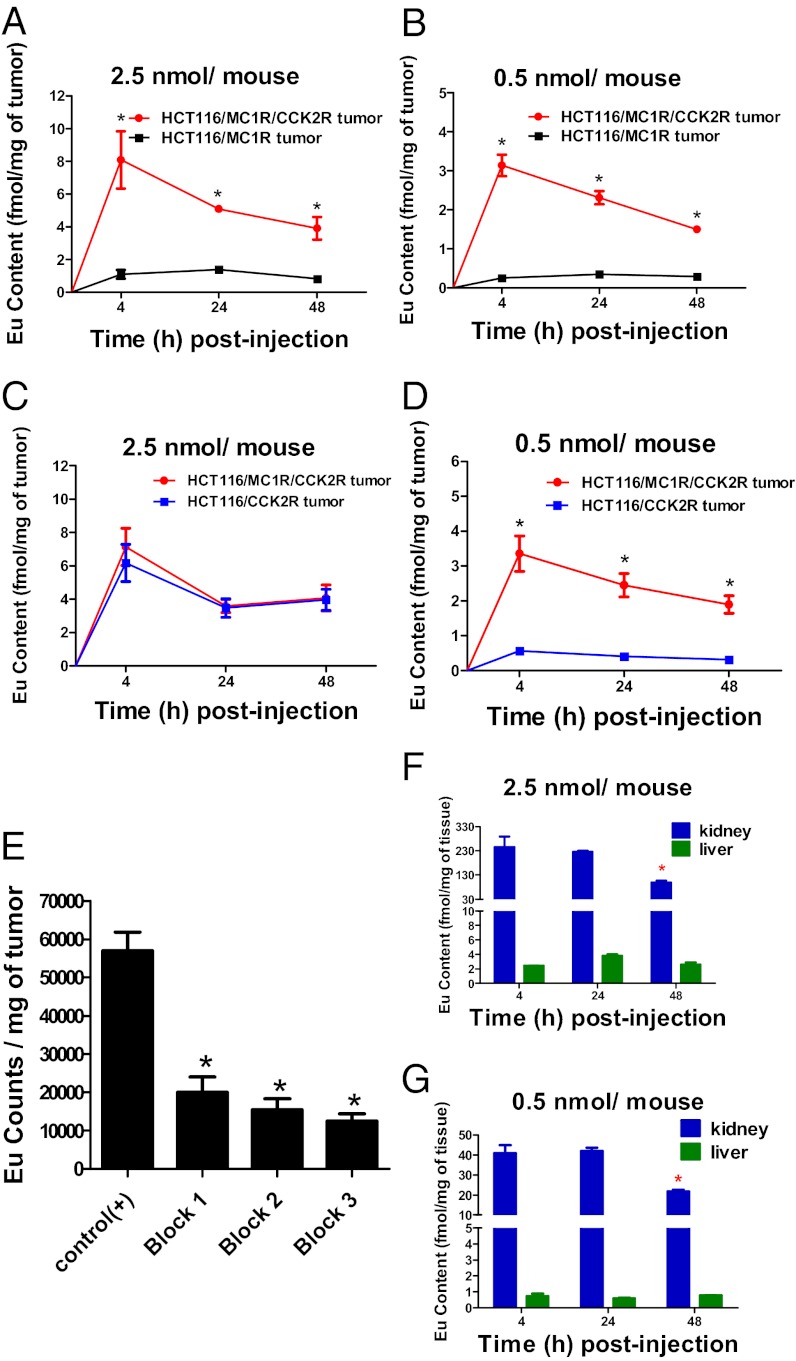
Fig. 4.
In vivo quantification of Eu htMVL 2 retained in target tumors. (A) Eu content (fmol/mg of tumor) was measured for each tumor from mice injected with 2.5 nmol Eu htMVL 2 as determined by time-resolved fluorometry. The Eu content in target tumors was significantly higher than that in MC1R control tumors. n = 3 for each time point. (B) Eu content in target tumors versus MC1R control tumors from mice treated with a lower dose (0.5 nmol per mouse). n = 3 for each time point. (C) Eu content in target tumors versus CCK2R control tumors with 2.5 nmol Eu htMVL 2 treatments. n = 3 for each time point. (D) Eu content in target tumors versus CCK2R control tumors with 0.5 nmol Eu htMVL 2. n = 8 for each time point. (E) Eu content was measured in the target tumors under the following conditions: Control (+) (n = 4): 0.5 nmol htMVL 2 per mouse; Block 1 (n = 6): 0.5 nmol htMVL 2 + 50 nmol NDP-α-MSH; Block 2 (n = 5): 0.5 nmol htMVL 2 + 50 nmol CCK8; Block 3 (n = 5): 0.5 nmol htMVL 2 + 50 nmol CCK8 + 50 nmol NDP-α-MSH. (F) Eu content was measured for the kidney and liver from mice injected with 2.5 nmol of htMVL 2. n = 3 for each time point. (G) Eu content was also measured with a lower dose (0.5 nmol per mouse) in the kidneys and livers. n = 3 for each time point. *P < 0.05.

