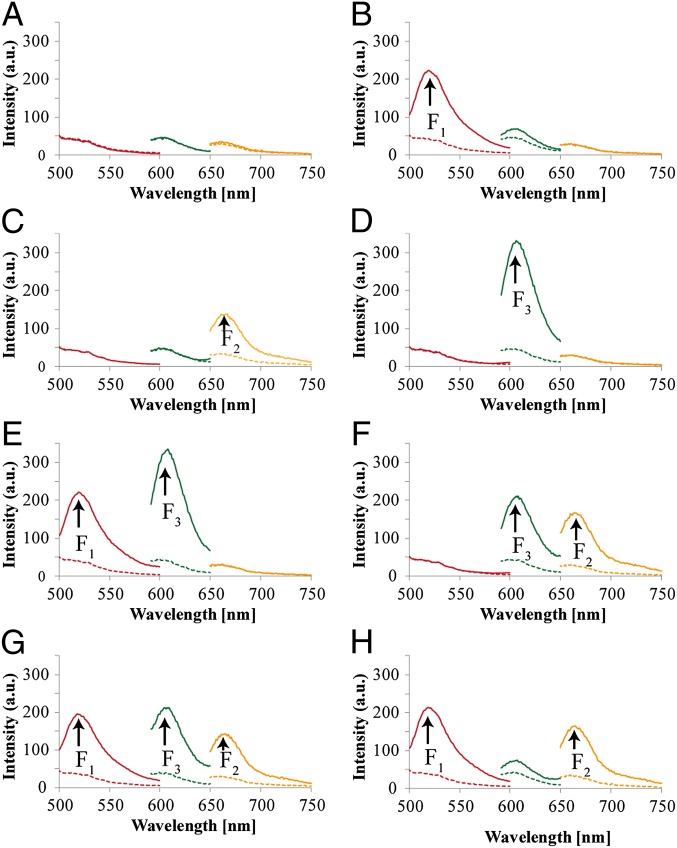
Fig. 2.
Output fluorescence intensities corresponding to the Toffoli gate using the following inputs: (A) 000, (B) 100, (C) 010, (D) 001, (E) 101, (F) 011, (G) 110, and (H) 111. Dashed lines correspond to the background fluorescence intensities before the addition of the respective inputs. Fluorescence spectra were recorded after a fixed time interval of 2 h.

