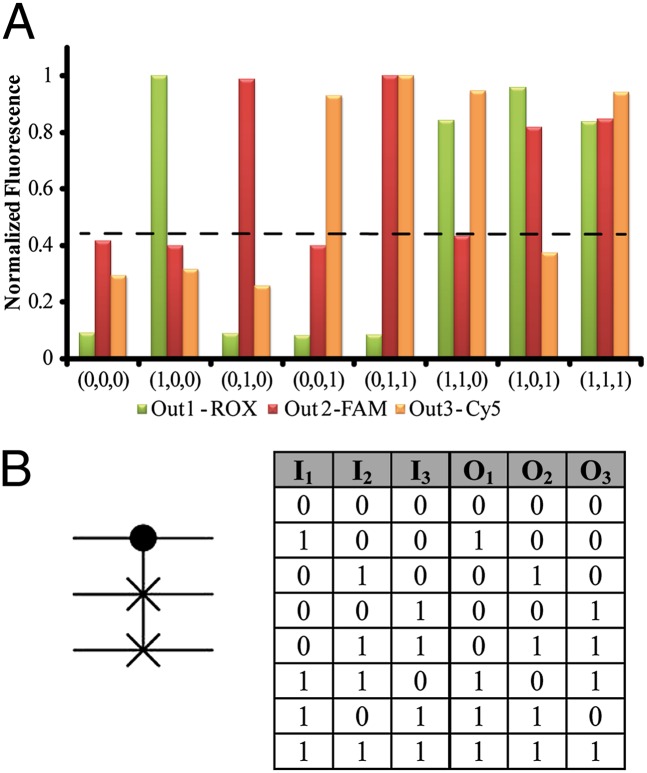
Fig. 6.
(A) Fluorescence intensities using different inputs in the form of a bar presentation. Dashed line represents the threshold fluorescence for defining the “0” or “1” outputs. (B) The representing symbol of the Fredkin gate and resulting truth-table corresponding to the order of input sets described in Fig. 4.

