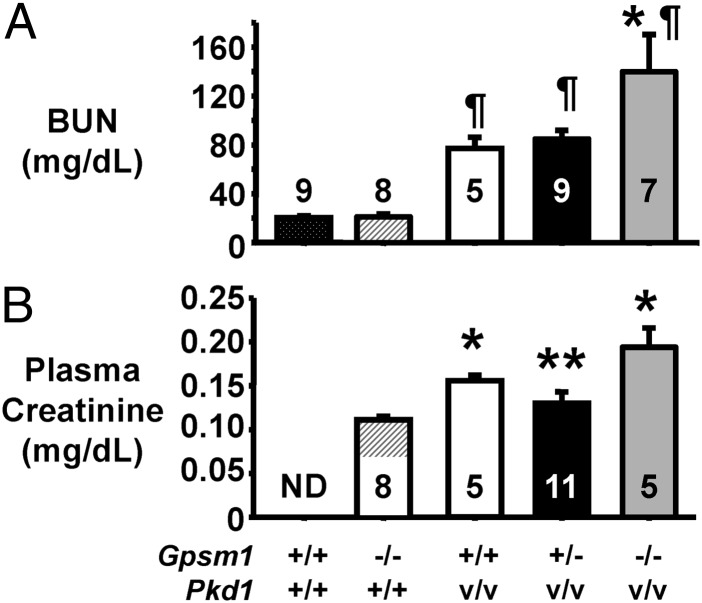
Fig. 4.
Decreased renal function in Pkd1V/V mice with Gpsm1 gene deficiency. Plasma was obtained from mice between P11 and P12 to measure the levels of either BUN (A) or creatinine (B) as a measure of renal function. (A) *P < 0.05 to P < 0.01: significant difference between Gpsm1−/−;Pkd1V/V and the other two Pkd1V/V mouse groups. ¶P < 0.05 to P < 0.001: higher significant difference between all Pkd1V/V groups and both Pkd1+/+ groups. (B) *P < 0.05: significant difference between noncystic Gpsm1−/−;Pkd1+/+ mice and the Pkd1V/V groups. **P < 0.01: significant difference between Gpsm1+/−;Pkd1V/V and Gpsm1−/−;Pkd1V/V mice. The numbers for each distinct genotype are shown in the bars of each graph. ND, not determined.

