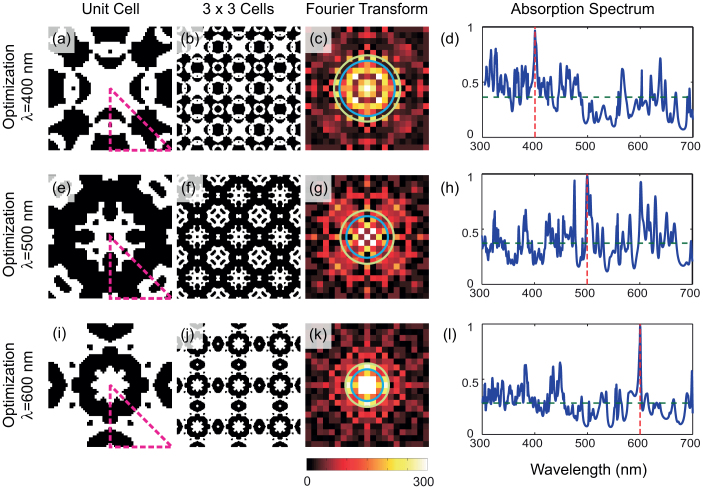
Figure 4. Results of the second optimization case, where the refractive index of the dielectric material in the scattering layer n = 1.7.
Unit cell and  cell of the scattering pattern for three different wavelengths of incident light are shown with black and white denoting dielectric material and air, respectively. The Fourier transformation of the scattering patterns are calculated and two fundamental TM modes of the slot waveguide (1st TM mode: yellow and 2nd TM mode: blue) are plotted in Fourier space, indicating the mode coupling between incident light and guided modes in slot waveguide. The absorption spectrum from 300 nm to 700 nm of the optimized scattering pattern is presented. The red and blue dash lines indicate the targeted wavelength and average absorption coefficient, respectively. (a) (b) (c) (d) Results of optimized scattering pattern for incident wavelength
  = 400 nm. (e) (f) (g) (h) Results of optimized scattering pattern for incident wavelength
  = 500 nm. (i) (j) (k) (l) Results of optimized scattering pattern for incident wavelength
  = 600 nm.

