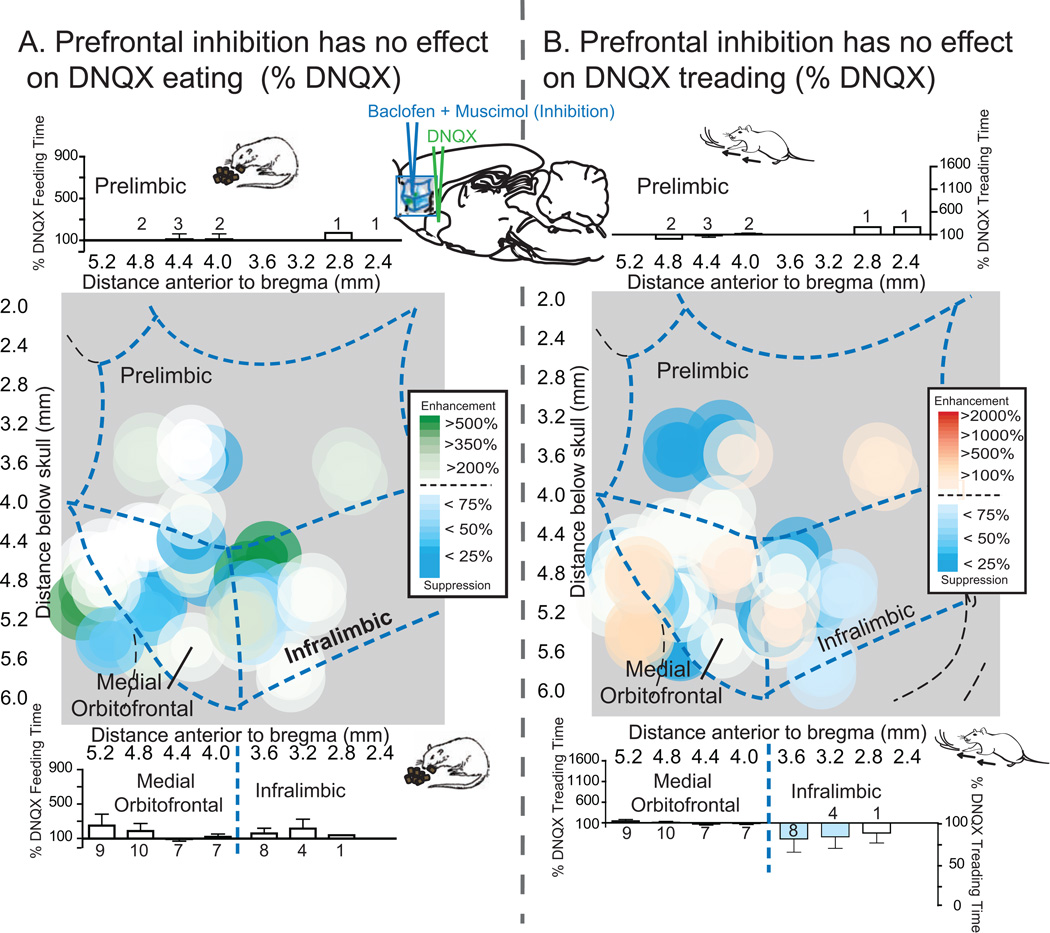
Figure 4. Maps of prefrontal inhibition effects on NAc shell DNQX generated eating and defensive treading.
Maps show the effects of prefrontal inhibition (n=30) on DNQX-induced eating (A, left) or defensive treading (B, right) at sites mapped on the sagittal plane of prefrontal cortex, color-coded for changes in behavior as a percent of DNQX. Histograms bars show mean behavior as percent of DNQX at each rostrocaudal level, split by dorsal (prelimbic, top; n=5) and ventral (medial orbitofrontal, n=16, and infralimbic, n=9, bottom) areas of prefrontal cortex (error bars = SEM).

