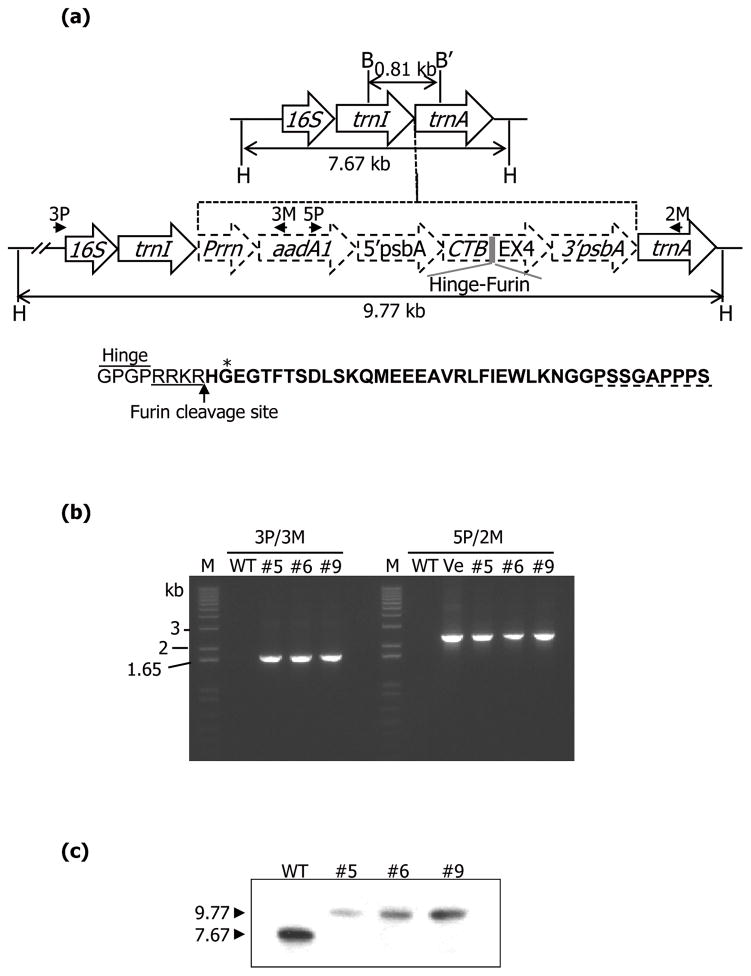
Figure 1.
Evaluation of transgene integration. (a) Schematic representation of the flanking sequence probe (0.81 kb) and expected products of the untransformed and transplastomic tobacco chloroplast genome when digested with HindIII (H). Southern blot probe was generated using BamHI (B) and BglII (B′). Primers used for transgene amplification are represented by arrows. Amino acid sequence indicates the hinge, furin cleavage site, and EX4 (bold letter). Asterisk represents resistant amino acid against DPP-IV. C-terminal 9-amino acid is represented by dotted line. (b) The amplification of genomic DNA fragment with 3P/3M and 5P/2M primer sets to check transgene integration. M, DNA size marker; WT, untransformed; #5, 6, and 9, transplastomic lines; Ve, CTB-EX4 containing pLD vector. (c) Southern blot analysis of CTB-EX4 transplastomic lines showing homoplasmy.

