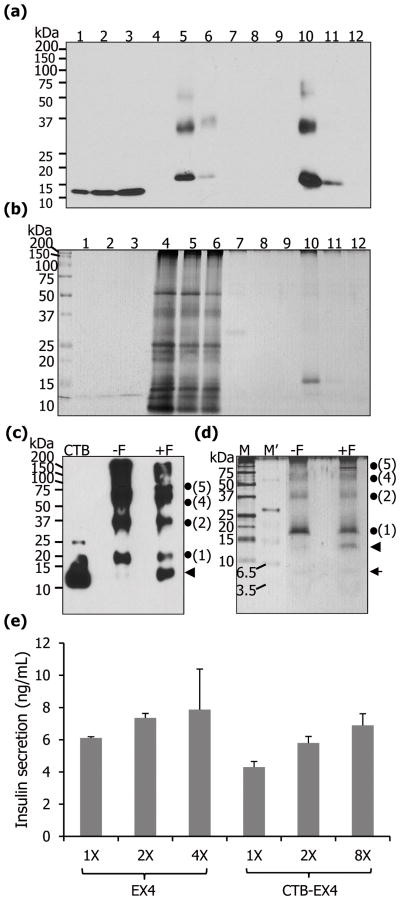
Figure 4.
Purification of CTB-EX4 and pancreatic cell line assay. Western blot (a) and silver staining (b) of purified CTB-EX4. 1–3, CTB standard proteins of 12.5, 25, and 37.5 ng; 4, wild type total leaf protein (5 μg); 5, soluble fraction of CTB-EX4 before purification (5 μg); 6, soluble fraction of CTB-EX4 after purification (5 μg); 7–9, washed fractions; 10–12, elution fractions. (c, d) Furin cleavage assay of purified CTB-EX4. CTB, standard (25 ng); −F, without furin; +F, with furin; M, protein size marker; M′, ultra-low range protein size marker; arrow head, cleaved CTB (12.7 kDa); arrow, cleaved EX4 (4.2 kDa); dots and numbers, locations of monomer and oligomers of CTB-EX4. Proteins were resolved on 12% (c) and 16% (d) of Tricine-SDS-PAGE. (e) Mouse pancreatic cell line assay. Commercial EX4 (1X =5 nM) and partially purified CTB-EX4 (1X = 32 nM, concentration based on the molecular weight of the CTB) were added to beta-TC6 cells. The graph was normalized to PBS value which was used as a negative control. Insulin secretion was compared at three different concentrations in each group, with duplicate samples, using 88 wells of insulin detection kit. Data shown are means ± SD (n=6).

