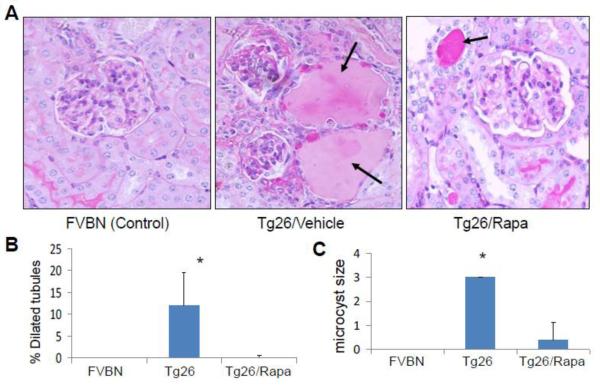
Figure 2. Rapmycin attenuates tubular dilatation and microcyst formation in HIVAN mice.
A. Representative microphotographs of cortical sections from a control, Tg26 and Tg26/Rapa are displayed. Control mice displayed no tubular abnormalities. Tg26 mice displayed microcyst formation (indicated by arrows) Tg26/Rapa revealed occasional microcyst formation (indicated by an arrow). Cumulative data showing percentage of dilated tubules per section in control,Tg26 and Tg26/Rapa mice. *P<0.01 compared with Tg26/Rapa
B. Cumulative data showing mean size of microcysts in control, Tg26 and Tg26/Rapa mice. *P<0.01 compared with Tg26/Rapa

