Abstract
Macromolecular crystal structures are among the best of scientific data, providing detailed insight into these complex and biologically important molecules with a relatively low level of error and subjectivity. However, there are two notable problems with getting the most information from them. The first is that the models are not perfect: there is still opportunity for improving them, and users need to evaluate whether the local reliability in a structure is up to answering their question of interest. The second is that protein and nucleic acid molecules are highly complex and individual, inherently handed and 3-dimensional, and the cooperative and subtle interactions that govern their detailed structure and function are not intuitively evident. Thus there is a real need for graphical representations and descriptive classifications that enable molecular 3D literacy. We have spent our career working to understand these elegant molecules ourselves, and building tools to help us and others determine and understand them better. The Protein Data Bank (PDB) has of course been vital and central to this undertaking. Here we combine some history of our involvement as depositors, illustrators, evaluators, and end-users of PDB structures with commentary on how best to study and draw scientific inferences from them.
Early Crystallography
In the 1960's we were working in Al Cotton's lab at MIT, inspired by Chris Anfinsen to try solving the crystal structure of Staphylococcal nuclease, a model system for protein folding without disulfides. At that stage, for us as "amateurs" with no connections to the initial protein crystallography groups in Britain, this meant reverse-engineering the methods from the published descriptions and the resulting structures, which took us seven years. That was a fascinating, educational, and mostly very enjoyable process. Fortunately, there was little external time pressure, because both Cotton and the other MIT crystallographers (such as Martin Buerger) considered it as an extremely long shot, and no one else knew that we were trying. Ted Hazen, as senior postdoc, did the protein chemistry and heavy-atom derivatives (cloning was decades in the future), developed crystallization conditions, and read the literature. Dave, as graduate student, grew the crystals, brought the equipment up to snuff, and wrote the computer programs (in Fortran, first on the IBM 7090/7094, then 360, then on the first time-sharing system, which we monopolozed on the night shift). Jane, as technician, coddled the data (first on film and then with paper tape and punch cards on the diffractometer), typed in Dave's programs, and hand-drew the map contours. And we all worked together to understand the methods and the molecule. In the final couple of years, the three of us had help from Jim Bier, Arthur Arnone, Victor Day, and Ada Yonath.
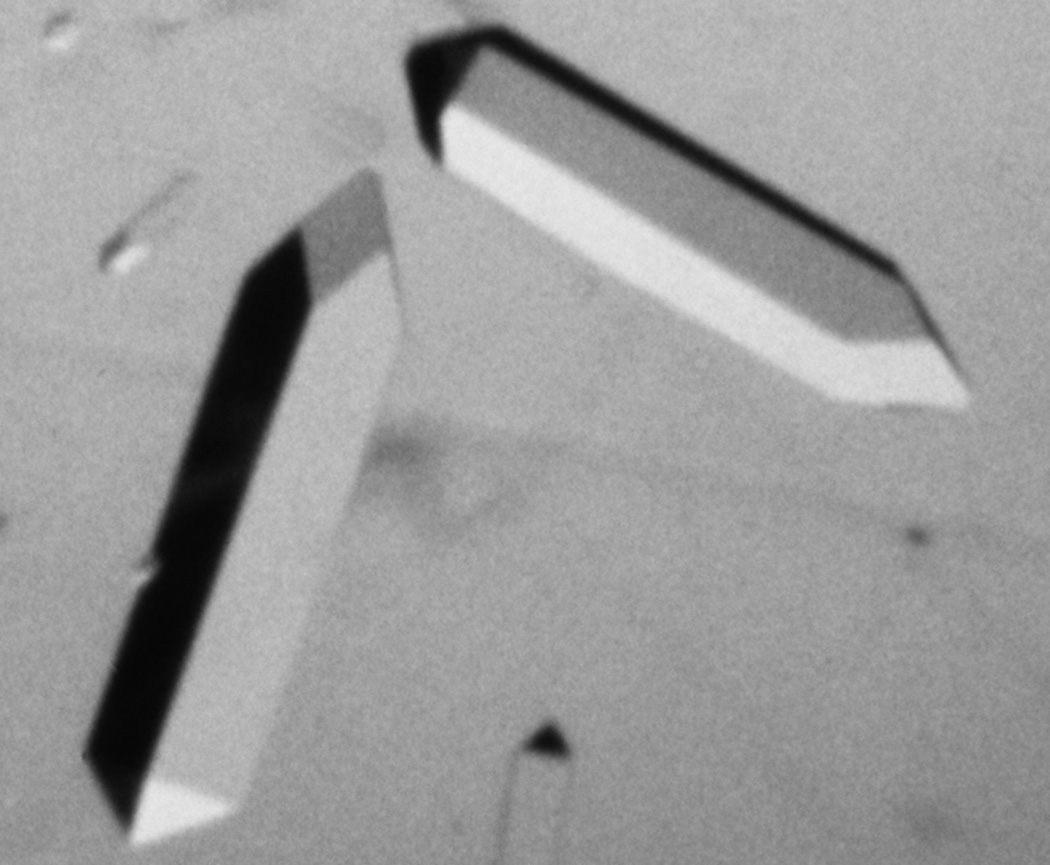
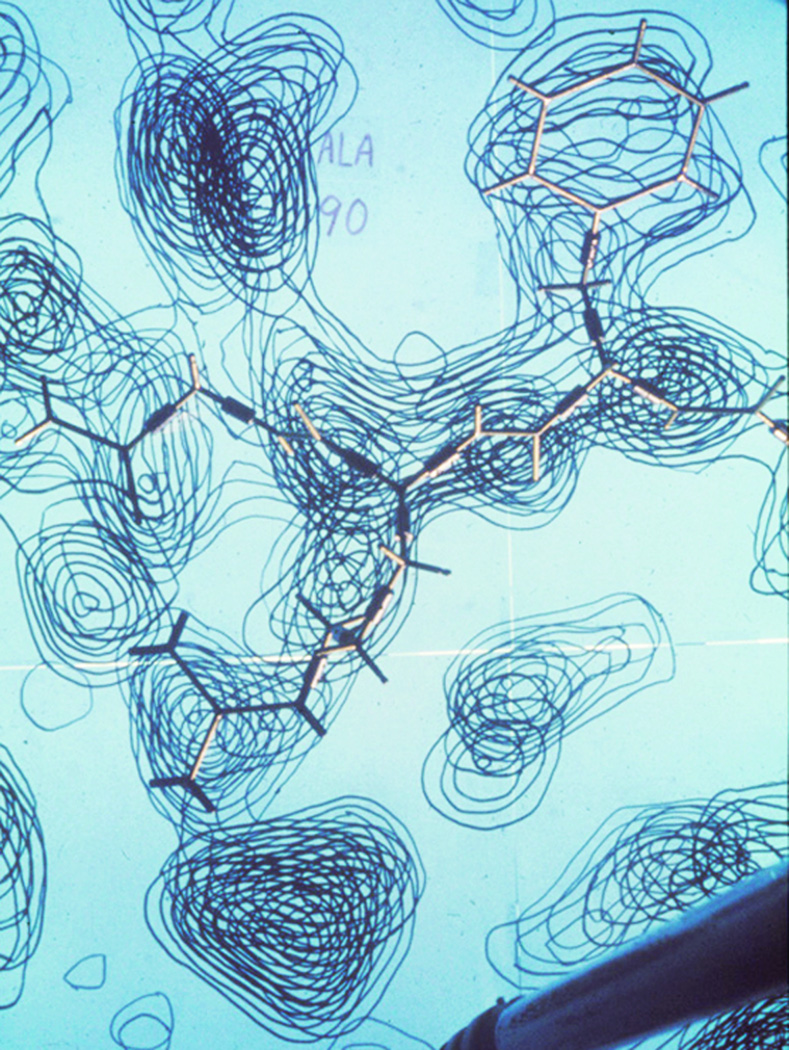
The nuclease crystals grew better if joggled, and one form had the charming property of showing the molecular asymmetry in their external morphology: as shown in Figure 1, one end of the 4-fold prisms (space group P41) terminated with rhombic faces and the other end with triangles (1). We eventually got diffraction to 2Å resolution, and solved the phases with multiple heavy-atom derivatives plus anomalous dispersion (overkill, actually). The final map, in 1969, was very cleanly interpretable and taught us what protein electron density really looked like, with three α-helices, an antiparallel β-barrel, and elegant arginines binding to the phosphates of the nucleotide inhibitor. Figure 2 shows a brass Kendrew model of an Arg and Phe on top of the big stack of glass sheets for our density map, with the guanidinium H-bonding between a backbone CO and the heavy, triangular density of a phosphate.
Figure 1.
The external morphology of these Staphylococcal nuclease crystals is reproducibly asymmetrical, one end terminating with 4 rhombic faces and the other with 4 triangles. This makes visible much of their internal organization: the handed, asymmetric nature and orientation of the protein chain in the asymmetric unit, related at the next level by the handed, directional 4-fold screw axis of space group P41.
Figure 2.
Photograph down into the stacked, hand-contoured glass sheets of the 2Å resolution electron density map of Staphyloccal nuclease, with a brass Kendrew-Watson model of the Phe34-Arg35 conformation on top.
That 2Å map, well phased and produced by Fourier transforms on the best computers of the time, was very accurate. But in those days the process of fitting the model to the density and then deriving 3D atomic coordinates from the model was amazingly primitive and inexact. At first we built a model separately, from measurements to beads pushed into the stack of contour-drawn glass sheets. A better modification involved hand-building of the brass model into the map image as seen through a half-silvered mirror in a "Richards box" (2), but model coordinates were measured with a plumb-bob and ruler. Refinement was also not possible. Therefore, those coordinates (deposited to the PDB (3; 4) in April 1973 as 1SNS) are rather accurate but very imprecise. They were obsoleted in 1982 by 2SNS, with extra data to 1.5Å but actually an even more imprecise model because a pioneering maximum-entropy refinement method was used (5). All punch-card and magnetic-tape forms of our original structure factors were lost over the years, but we still had printout; Lizbeth Videau entered and checked them, and they are available in the obsolete section of the wwPDB ftp site as r1snssf.ent.gz. Unfortunately the 2SNS structure factors were never deposited and so cannot be re-refined with modern methods.
At the time, we figured our nuclease had tied for tenth distinctly different protein structure with cytochrome C (6). But it was probably eleventh, as well as we can reconstruct the timing: after myoglobin/hemoglobin (7; 8), hen egg lysozyme (9), ribonuclease A/S (10; 11), chymotrypsin (12), papain (13), carboxypeptidase (14), subtilisin (15), lactate dehydrogenase (16), trypsin inhibitor (17), and rubredoxin (18). Publication, as well as most other things, was more leisurely in those days, and the 2Å chain-tracing paper for Staphylococcal nuclease came out in early 1971 (19). After a year's interlude at NIH in Chris Anfinsen's and David Davies' labs, in 1970 we moved to Duke University.
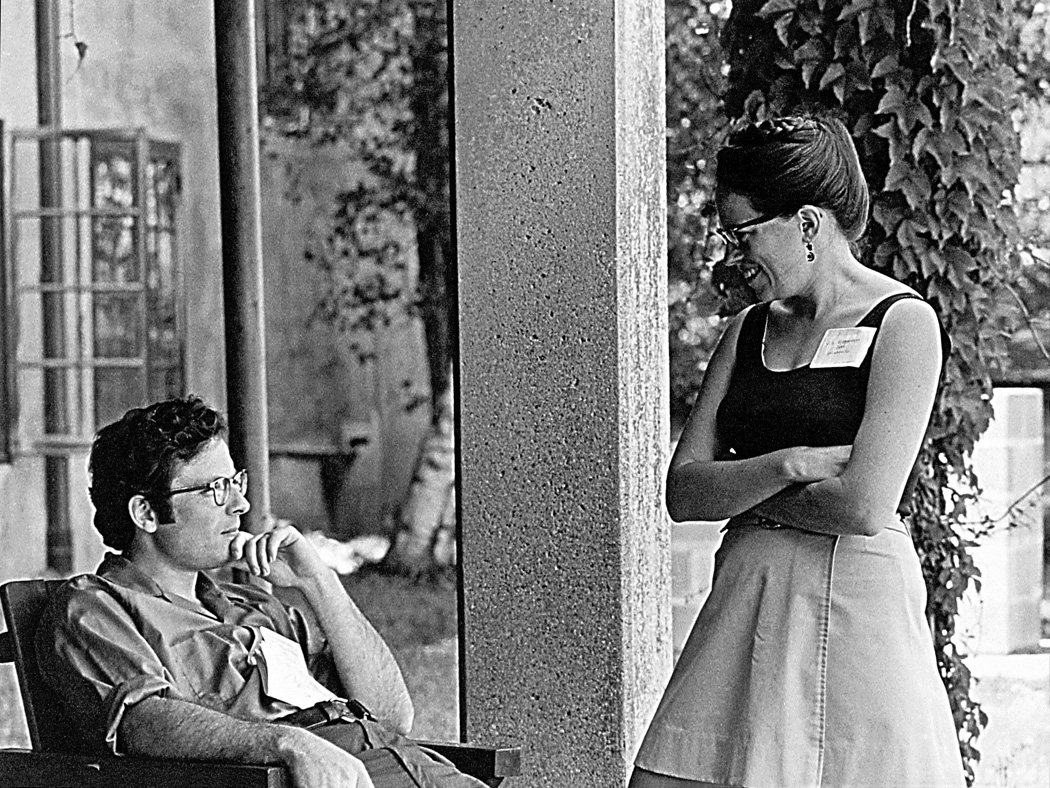
June of 1971 saw the Cold Spring Harbor Symposium in Quantitative Biology that is considered the birth occasion of the Protein Data Bank. We were there (see Figure 3), although as quite minor players, and were not involved in the PDB planning. Al Cotton spoke about the Staph nuclease structure (20), Alan Schechter about its biochemistry (21), and Oleg Jardetsky about its folding (22). We were particularly fascinated by the spirited, continuing discussions about the allosteric mechanism of hemoglobin, which often took place outdoors on the grass.
Figure 3.
Dave and Jane Richardson at the 1971 Cold Spring Harbor Symposium in Quantitative Biology. Photograph courtesy of the Cold Spring Harbor Laboratory archives.
At Duke, we worked on the crystal structure of Cu,Zn superoxide dismutase. It was then the biochemistry departmental enzyme – Irwin Fridovich had discovered its function (23), Bob Hill determined its sequence (24), and we grew crystals and solved the structure (25). The α-carbon coordinates for the 2 dimers in the asymmetric unit were actually published in print (26), and were deposited in the PDB as 1SOD in 1975. Our 1SNS and 1SOD were 2 of about the first 20 proteins deposited into the PDB, and we also contributed the coordinates to Richard Feldmann's AMSOM microfiche atlas (27). That was the era when our lab developed "Byron's bender", a device for making physical Cα-backbone models from 1/8" steel wire (28), which was the method of choice for several years until computer graphics became practical. SOD was used as the "driving problem" for developing the Grip-75 system in Fred Brooks' computer graphics lab at UNC-Chapel Hill (29; 30). Grip-75 used a specially designed mainframe to support the interactive calculations (displayed in black&white), and had a marvelous set of input control devices for viewing and changing the model in the map. The full-atom model of SOD was the first one ever built in interactive computer graphics before a physical model (31); within a few months Greg Petsko's neurotoxin became the first structure built at UNC by an outside group (32). Many crystallographers visited UNC to fit their models in the 70's, and it was the conceptual basis from which Alwyn Jones developed the more portable Frodo system (33).
Refinement of protein structures had become feasible by then, and we used ProLSQ (Hendrickson 1979) to refine the 4 Cu,Zn SOD chains in the asymmetric unit. However, the process was still slow, expensive, and as yet involved no quality controls except bond lengths and angles and the R-factor to data. In 1980 1SOD was obsoleted by 2SOD, complete coordinates with data out to 2Å, rebuilt, refined, and analyzed (35). That was a great improvement, but still scores very badly on modern validation such as MolProbity. The SOD structure factors were lost (files deleted by the computation center because they were more than 2 years old), so we can't repair the problems - extremely embarrassing for us! In the 1980's we were signatories on the letter spearheaded by Fred Richards that successfully urged coordinate deposition policies for journals, for NIH, and for the crystallographic community. In the 1990's, as first head of the PDB user group (at Brookhaven), Jane lobbied successfully for the initial version of the biological unit file.
Ribbon Drawings, on Paper and On-Screen
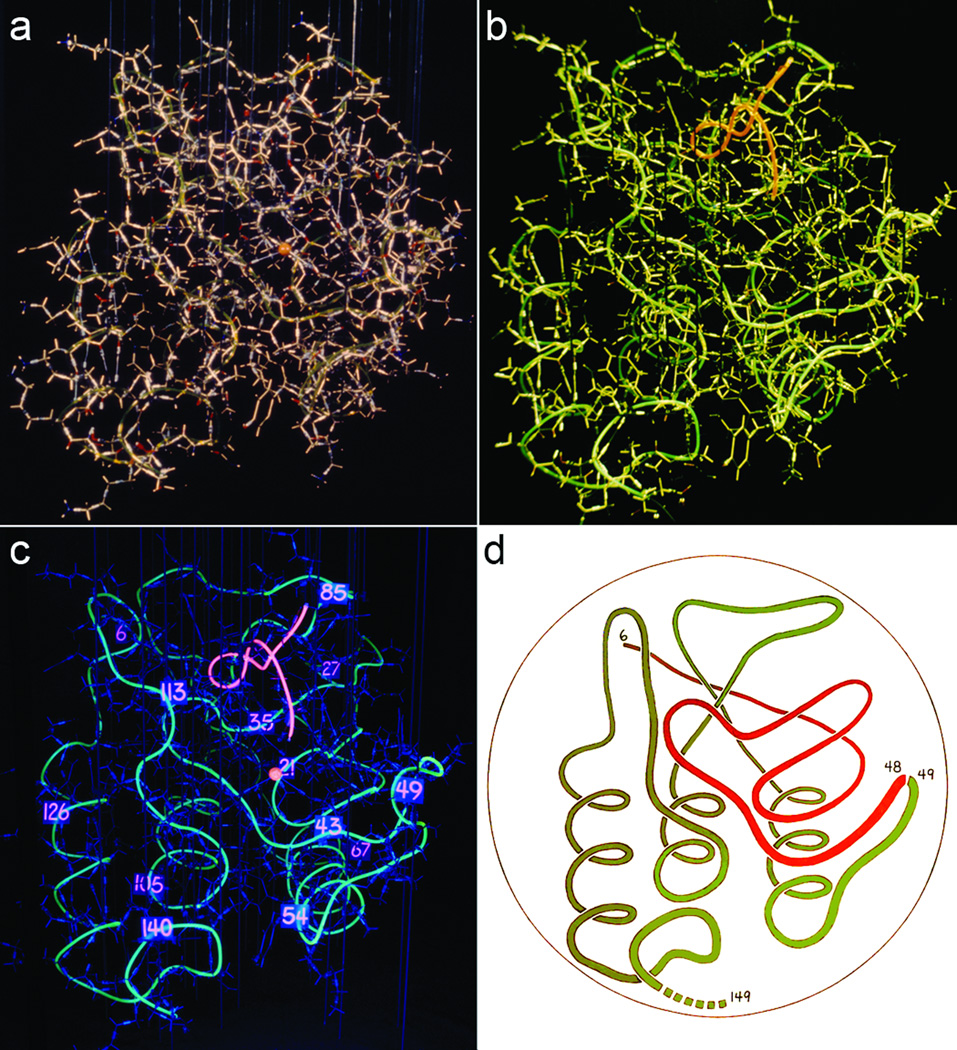
A list of atomic coordinates stores the information, but is essentially useless for human comprehension. Physical models of brass or plastic or steel are excellent if you can handle them in person, but are time-consuming to make and don't communicate well in print. We started to address this problem in 1969, when Chris Anfinsen suggested attaching tygon tubing along the backbone of the Staph nuclease model we had built in his lab at NIH, and filling it with fluoroscein or rhodamine dye that could show the chain trace under UV light (Figure 4a–c). The final result is eerily reminiscent of later computer graphics. It is smoothed somewhat, but the β strands still wiggle, and one still has difficulty following the course of the chain from N to C terminus. Jane used those photos to make a further simplified "worm" drawing (Figure 4d), in this case to show the cleaved parts of nuclease that can still fold stably. Dave later taught himself to draw the hemoglobin tetramer as a worm on the blackboard in class, with the helices as wider swaths of chalk.
Figure 4.
The physical transition from an all-atom model to a precursor of ribbon drawings. The brass model of the Staph nuclease molecule (1SNS; 19) decorated with tygon tubing, filled with fluorescein along the backbone (green) and rhodamine for the thymidine diphosphate inhibitor (red). a) room lights; b) room and UV; c) UV only; d) "worm" drawing by Jane Richardson, based on the image in c.
This process had sensitized us to backbone shapes, and while working toward the SOD structure we moonlighted by going into what would now be called structural bioinformatics – looking for 3D patterns that recur in many different proteins. First was the discovery that β–strand crossover connections are essentially always righthanded (36), published nearly simultaneously by Janet Thornton's group (37). Once SOD had been traced and we had a bent-wire model of it, we encountered David Davies carrying a bent-wire model of an immunoglobulin domain and both immediately recognized the similarity of folds, which had not been evident from the published figures. That led to description of the Greek key β-barrel fold (38) and to further classification of β-sheet topologies such as singly-wound TIM barrels and doubly-wound Rossmann folds (39). Later we described β-bulges (40), helix N-caps and C-caps (41), the tyrosine corner (42), the negative design of edge β-strands to prevent aggregation (43), and an all-angle conformer library for RNA backbone, defined for the "suite" unit from sugar to sugar and given 2-character names such as 1a for A-form (44). Such descriptions of folds and motifs are one important way for people to remember, compare, and interpret the PDB's structures.
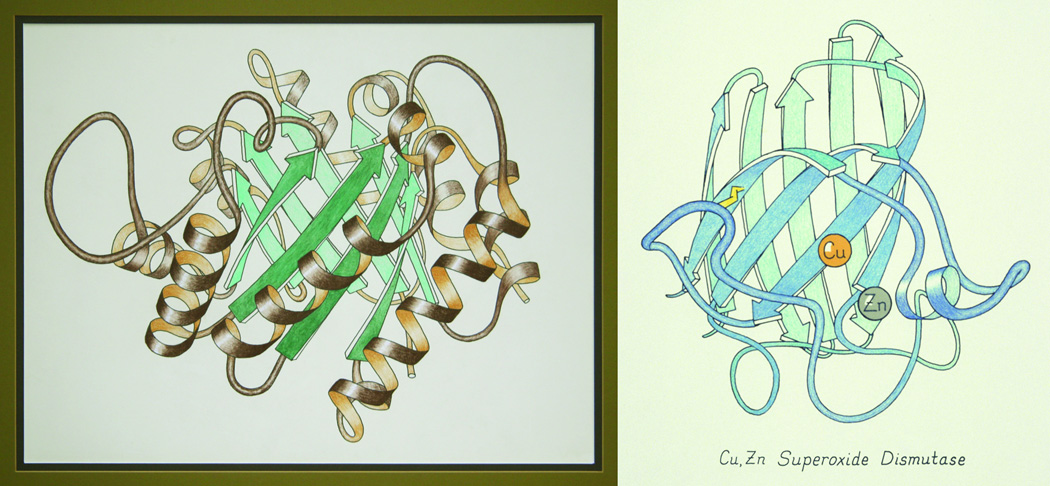
In 1979 Anfinsen, as an editor of Advances in Protein Chemistry, persuaded Jane to undertake a review article about 3D protein structure, at both the fold and the local level. As a major feature, it would try to address the difficulty of representing protein 3D folds comprehensibly on the printed page, standardized so that similarities would be clear. She spent an entire year working out convincing, clear representations (some adapted from the few earlier drawings, others new), learning how to draw them, and illustrating all 75 distinct protein domains then known. Getting the right degree of smoothing was crucial, and the translation into ribbon requires different rules for helix, strand, and loop. Details of the drawing methods and their rationale are explained further in (45), (46), and http://en.wikipedia.org/wiki/Ribbon_diagram. The ribbons were first done as high-contrast line drawings in ink, but a few favorites were hand colored, such as the TIM and SOD shown in Figure 5. Then Jane and Dave both spent most of the following year researching and writing the text and photographing the drawings for the 174-page "Anatomy and Taxonomy of Protein Structures" (47; on-line with annotations at http://kinemage.biochem.duke.edu/teaching/anatax/). The ribbon drawings were immediately accepted as a helpful interpretation, used for specific structures, as textbook illustrations, and as book and journal covers. The idea of ribbons has even found its way into the ingenious logo of the wwPDB Foundation (Figure 6).
Figure 5.
Early ribbon drawings of the (βα)8 "TIM barrel" of triose phosphate isomerase (1TIM; 77) and the Greek key β-barrel of Cu,Zn superoxide dismutase (2SOD; 35). Hand drawn and colored by Jane Richardson, in pastels and colored pencil, respectively. The TIM drawing was Wikipedia Picture-of-the-Day for November 19, 2009; these and others are available at http://commons.wikimedia.org/wiki/User:Dcrjsr.
Figure 6.
Logo of the wwPDB Foundation, combining the world globe, the mind of an individual, the ribbon representations of an α-helix, and an upward-looking β-strand. Designed by Maria Voigt, Rutgers.
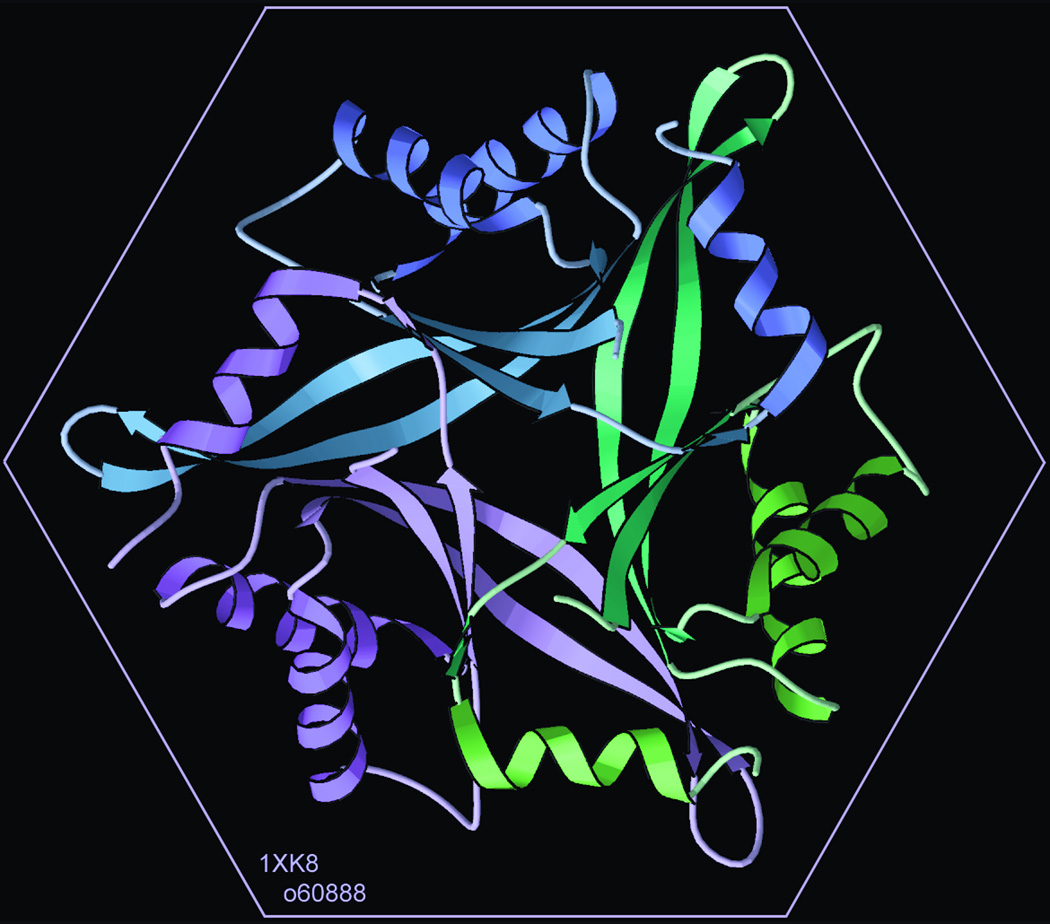
Very soon there were software adaptations of the ribbon-drawing concept, first simply to automate producing 2D images, but soon for the huge advantage of interactively rotatable ribbons. The various early versions each simplified some features, such as using unsmoothed peptide planes in the loops, showing helices as cylinders, or using simple spline smoothing throughout (which makes helix a narrow, stretched spiral along the axis). The first system to reproduce the hand-drawn conventions was Mike Carson's Ribbons program (48), which applied a curvature-based correction to move the helix spiral out to the cylinder traced by the polypeptide backbone. This algorithm was immediately adopted by Dave for his Chaos program on the Evans & Sutherland vector-graphics hardware, and has been used by most later molecular graphics software including Dave's Mage (49) and Ian Davis' KiNG (50; 51), as for instance in Figure 7. The kinemage graphics system that underlies Mage and KiNG was developed by Dave in 1990-2, in order to support interactive macromolecular displays on the first small personal computers. Its difference from nearly all other molecular graphics is that its storage medium is a generic intermediate display-list file (including ribbons as well as stick models, dot surfaces, map contours, lines, labels, explanatory text, etc) that is human readable and editable, and rather easily read by other programs as well. These days even we normally edit kinemages on-screen rather than in the ASCII-text kinemage file, especially since Mage and KiNG also support rebuilding the model.
Figure 7.
Computer-graphics ribbon schematic of the trimeric human divalent-cation tolerant protein CUTA, from the SECSG (1XK8; 78). Drawn in KiNG (51).
Computer-drawn ribbons do a much better job of helices, following bends or widened turns without sacrificing the perception of continuity, and letting the ribbon plane flare out slightly as the peptide planes do, which shows chain direction to the 3D-literate viewer. On the other hand, they are often not as effective as the hand drawings at disambiguating the chain trace or at giving a sense of beta structure as coordinated sheets rather than a collection of individual strands. And, of course, an interactively movable ribbon beats any 2D image for true structural comprehension, if not always for the contemplation of beauty. Although extra features such as cast shadows are more distracting than helpful, well-done shading and rendering add a great deal to the 3D realism.
Ribbons have become an indispensable part of the process of understanding the 3D structures of protein and nucleic acid molecules. Java-based graphics such as JMol (52) or KiNG can give a rapid glance at overall structure, interactive in 3D directly on a web site. Sophisticated systems such as UCSF Chimera (53), KiNG, or Warren DeLano's PyMol (http://sourceforge.net/projects/pymol or http://www.pymol.org) allow the user to build from the ribbon as a memorable frame of reference in 3D, and then add more detailed local representations of the features of interest for some particular question at hand.
Validating and Improving Macromolecular Structures
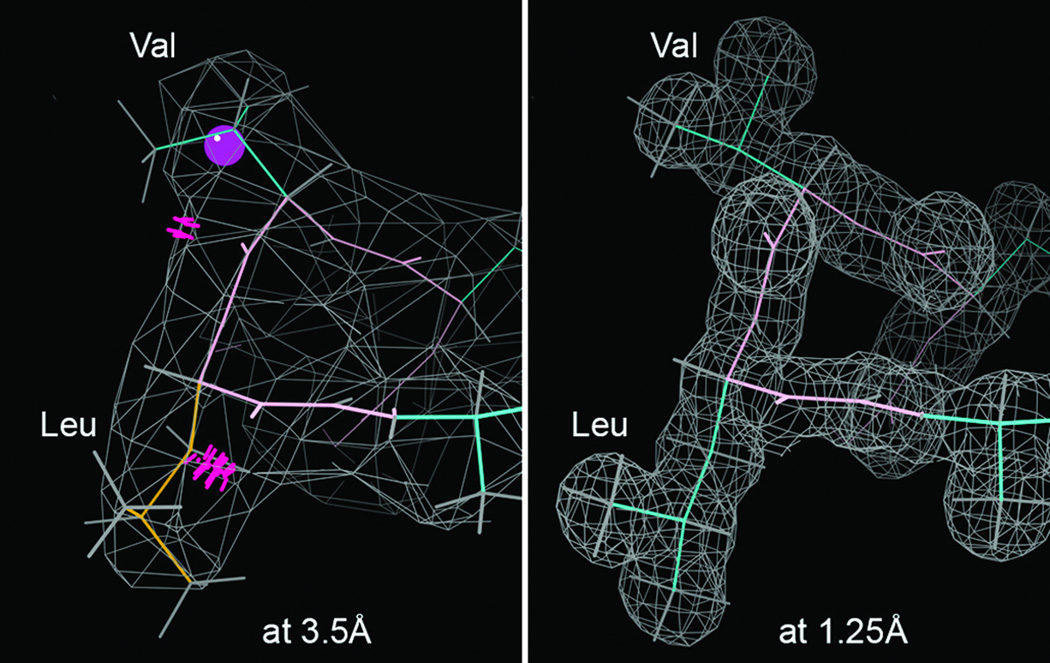
The Richardson lab works at spreading molecular 3D literacy - through education (54), through user-friendly ways of describing and visualizing 3D structures, and through developing methods for evaluating and improving the global and local quality of those structures. A second problem in getting the most out of the PDB's structures is that their accuracy varies a great deal both between and within entries. As illustrated in Figure 8, resolution is the most important global variable determining model quality. Near 1.0Å resolution every atom is seen clearly, so that the details of backbone, sidechain, and ligand conformation are unambiguous. At 3-4Å, in contrast, many sidechains are reduced to small nubbins, so that people and software scrunch them down into the density when actually some atoms should be outside the contours. This often produces wrong conformations (such as the backward Leu and Val), bad geometry, steric clashes, and even, more often than one would like, the sequence may be fit out of register. At 3-4Å resolution the overall fold and comparison to related structures are almost certainly correct, but conformational details cannot be trusted. At 2Å resolution, most details are quite reliable but there are occasional mistakes that displace atoms by considerable distances, usually identifiable by a combination of validation checks.
Figure 8.
Comparative information content and its consequences at high vs low resolution, for the same turn of helix in hemoglobin (β 108–111). At 1.25Å (2DN2; 79) in a well-ordered (low B-factor) region, each atom is observed and conformations are unambiguous. At 3.5Å (2QLS; 80) even in the best parts the electron density is smoothed out; in helix the backbone conformation can be inferred, but sidechains are too-small, uninformative blobs that are routinely misfit: here with a rotamer outlier (gold), a Cβ deviation (magenta ball), and 2 serious all-atom clashes (hotpink spikes), confirmed as incorrect by the high-resoluion structure.
At the local level, the crystallographic "B-factor" is the most important variable for determining accuracy - it measures how smeared out the electron density is, either from molecular motion or from some type of error. Even at atomic resolution, if atoms are fit in a high-B, disordered region they are very likely to be incorrect. Average B-factors get higher as resolution gets lower, and they are not treated the same by different software or protocols. But for local evaluation of reliability within a structure, check out some backbone B values in the core and make sure that B's in your region or ligand of interest are not over twice as high. [Some graphics programs can show B value for a selected atom, and in the PDB file for a crystal structure each atom record gives x, y, z, B, and occupancy.] If you are looking at an NMR structure, you need to consider the local variability of the models in the ensemble. Again, large variability can result from motion, from error, or from missing data - but in any of those cases it means that the positions or conformations are not well determined.
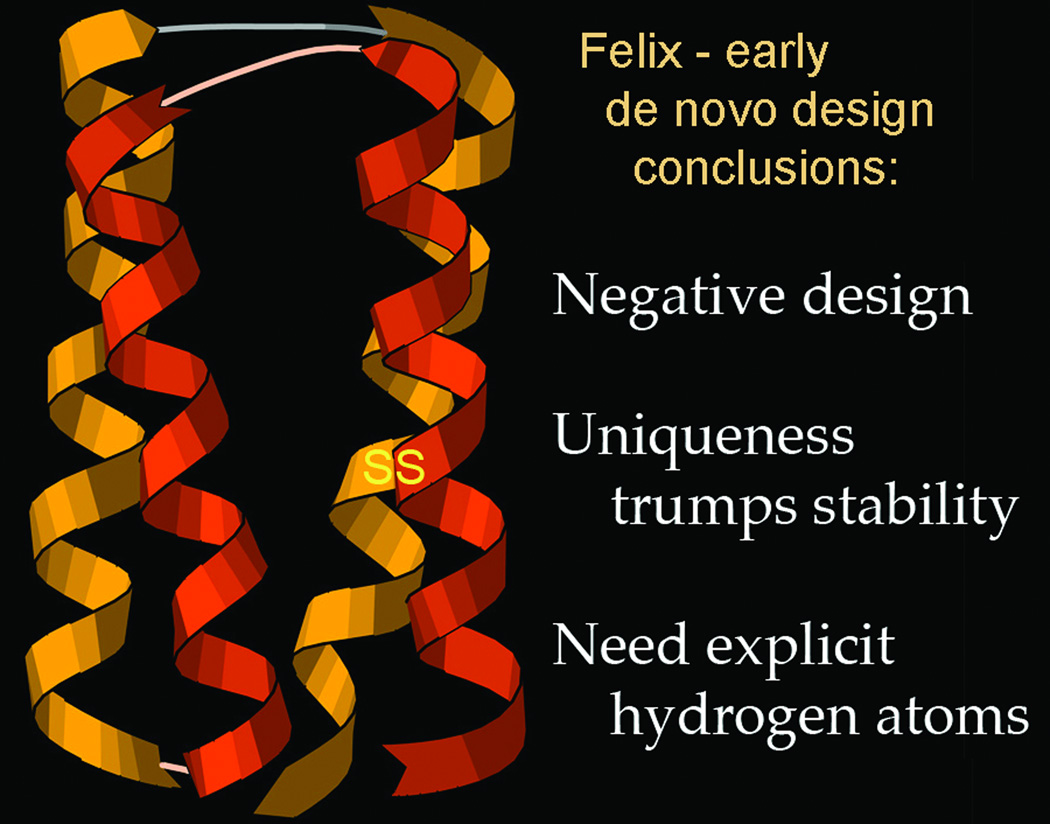
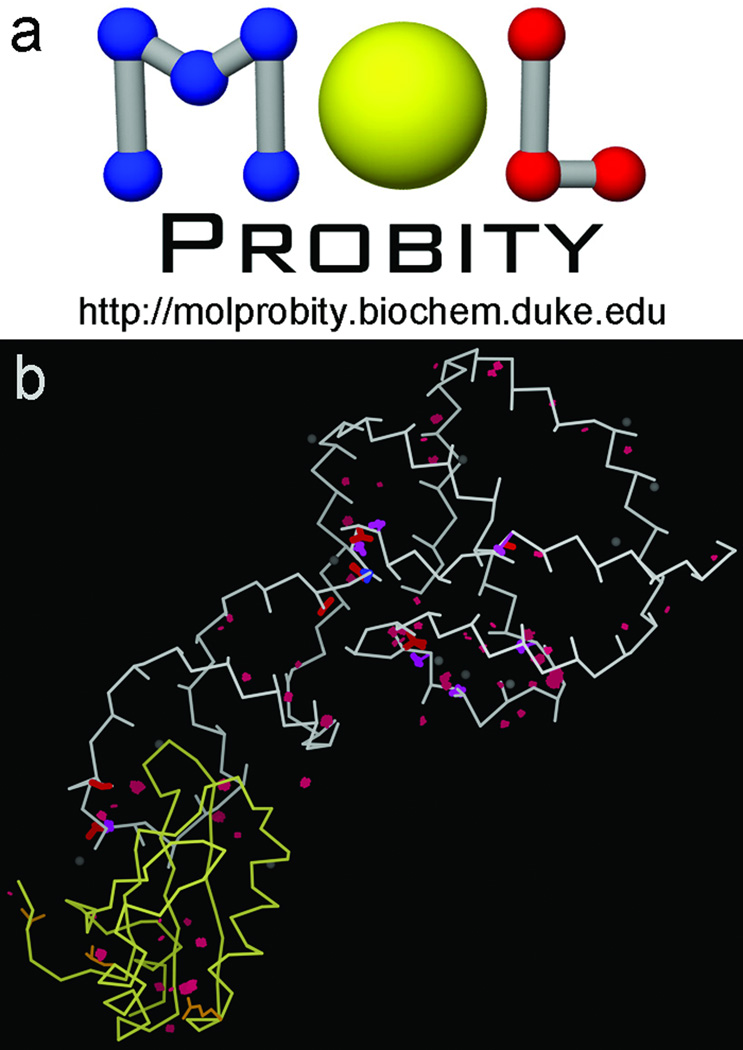
Complementing resolution and B-factor are model-validation tools, first developed around 1990 with sidechain rotamers (55), bond length and angle geometry and Ramachandran (ϕ,ψ plot) measures (56; 57), and Rfree cross-validation of model-to-data match (58). We had been doing protein de novo design (59; 60; 1FLX, 2FLX), producing the correct secondary structure and fold, and formulating the principle of negative design, but learning that uniqueness is harder to achieve than stability (Figure 9). Most importantly, we concluded that one reason for the then-general inability to produce well-ordered, native-like designs was the lack of explicit H atoms and of a sensitive measure of internal packing (61). To remedy that, we developed the Reduce program to add all hydrogens, optimizing each local H-bond network with OH and NH3 rotation, His protonation, and 180° flips of Asn/Gln/His groups (62), and developed the all-atom-contact analysis method to evaluate and display all atom-atom steric clashes, H-bonds, and favorable van der Waals contacts (63). A numerical measure that proved very useful is the "clashscore", defined as the number of serious all-atom steric clashes (≥0.4Å overlap) per thousand atoms. All our lab software is freely available (at http://kinemage.biochem.duke.edu/software) open source and multi-platform, but wide use by others only began in 2002 when Ian Davis implemented the first version of the MolProbity web service (Figure 10a; 51). It provides a very easy way to run all-atom-contact validation on a structure uploaded by the user or fetched by code from the PDB, with interactive display of flags on the 3D structure directly on-line in KiNG (64) as shown in Figure 10b for the startup overview; full detail can be turned on for local study.
Figure 9.
Summary of conclusions from Richardson-lab work in early de novo protein design (61). The ribbon schematic shows the designed model for the Felix 4-helix-bundle, native-like sequence composition de novo design (60; 1FLX in the PDB model section). Ribbon drawn in Mage (49).
Figure 10.
MolProbity structure validation. a) logo and url; b) multi-criterion kinemage showing several local clusters of outliers in 3D for both RNA and protein in 1CX0 (81), interactive on-line in the KiNG Java kinemage viewer (51).
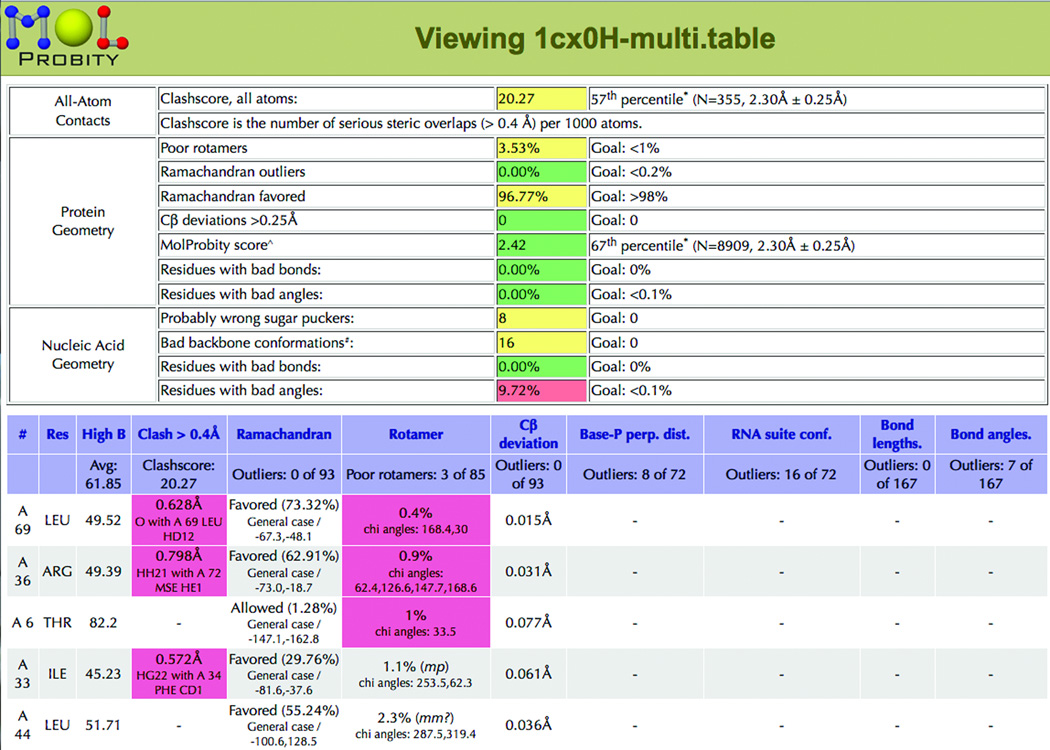
No single validation measure can catch all problems in a 3D model, because each is sensitive to different features and because any one specific measure can be optimized at the expense of everything else. Therefore, to make a broadly effective validation service we included updated versions of the traditional geometry, Ramachandran, and rotamer criteria, implementing B-factor filtering, smoothly contoured reference distributions, and new features such as the Cβ deviation and the omission of always-incorrect "decoy" rotamers (66; 67). The validation scores and percentiles are summarized on MolProbity as a "traffic light" display and individual outliers are listed and flagged for each residue in a sortable chart (Figure 11) and displayed in 3D on a "multi-criterion" kinemage such as in Figure 10b. We also work on describing and validating RNA structure, concentrating especially on the full-detail backbone comformation which is difficult to fit well because it has 6 variable angles per residue and is not seen very clearly at the resolutions typical for large RNA structures (68; 44; 50). MolProbity reports geometry, ribose pucker, and backbone-conformer outliers for RNA (Figure 11). The site has many forms of output: the multi-criterion kinemage graphics file to guide rebuilding each problem to the electron density in KiNG, a script of jump-to buttons for rebuilding outliers in Coot (65; either independently or as linked directly to the MolProbity-style validation within Phenix(69)), tables of scores, Ramachandran plots, strings of RNA backbone conformers. etc.
Figure 11.
MolProbity validation summary and the top of sortable multi-criterion chart, for 1CX0. The balance of good "traffic light" summary colors and the 67th percentile MolProbity score show that this is an about-average quality structure, actually very good for this pioneering large RNA (81). The per-residue details in the chart (sorted by rotamer), or in the kinemage, could guide rebuilding of the local problem areas.
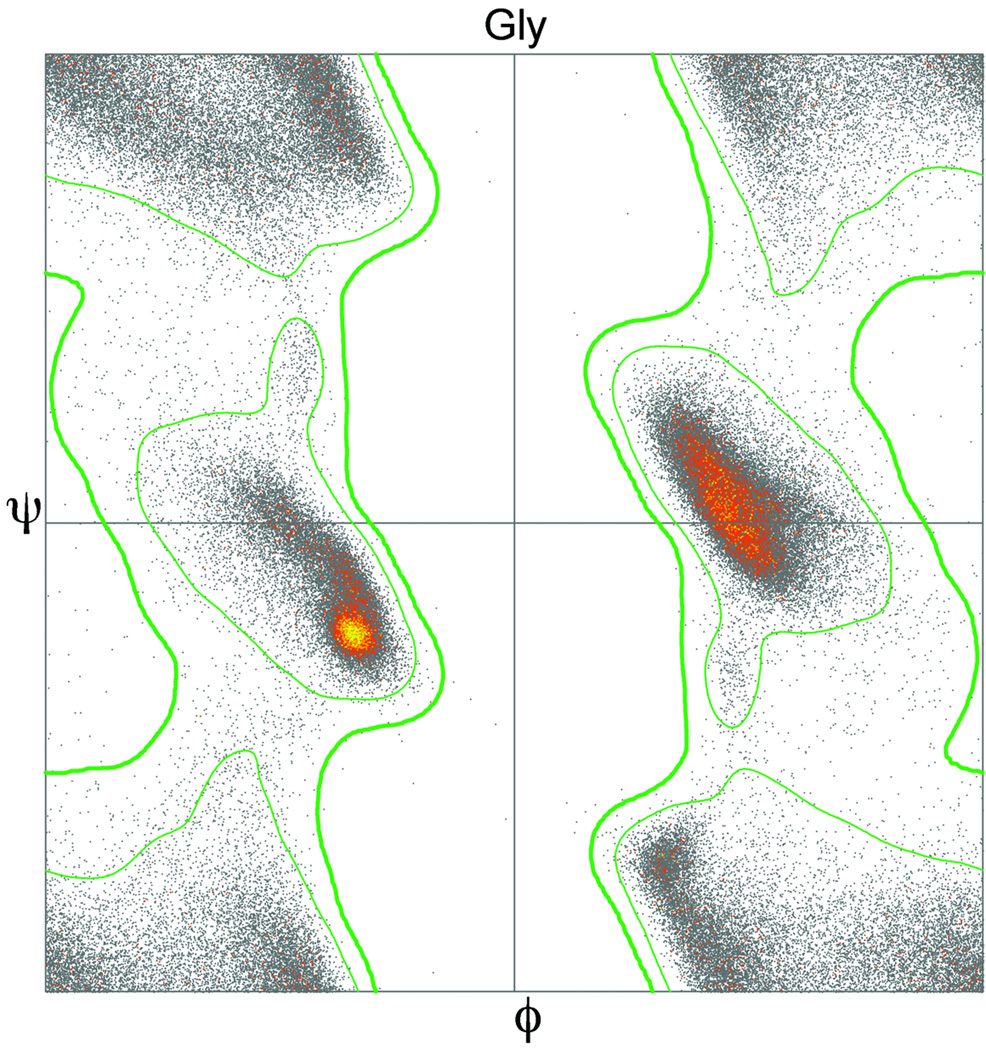
Validation criteria have improved over the years, as a function of larger and more accurate reference datasets from the growing PDB and also from better methods for smoothing, filtering, and classifying the data. ProCheck Ramachandran measures came from the 100,000 total residues in the 1991 PDB with no filtering at all; our original MolProbity Ramachandran used our Top500 dataset of structures filtered by resolution and B-factor to give 100,000 high-quality residues (67); now we are using the Top8000 data with over 1.5 million filtered residues. This lets us split them into 6 classes: general-case (16 amino-acids), Ile/Val, Gly, transPro, cisPro, and pre-Pro. Figure 12 shows the glycine Ramachandran data (over 100,000 residues) and the favored/allowed and allowed/outlier contours.
Figure 12.
Ramachandran plot for the 116,789 glycine residues with B-factor ≤30 in the Top8000 dataset of protein chains, color-coded by the number of datapoints in each 0.1° ϕ,ψ bin. Inner contour (symmetrized) encloses 98% of this quality-filtered data (favored region) and outer contour encloses 99.9% and excludes 0.1% of the data (the Ramachandran outliers for Gly).
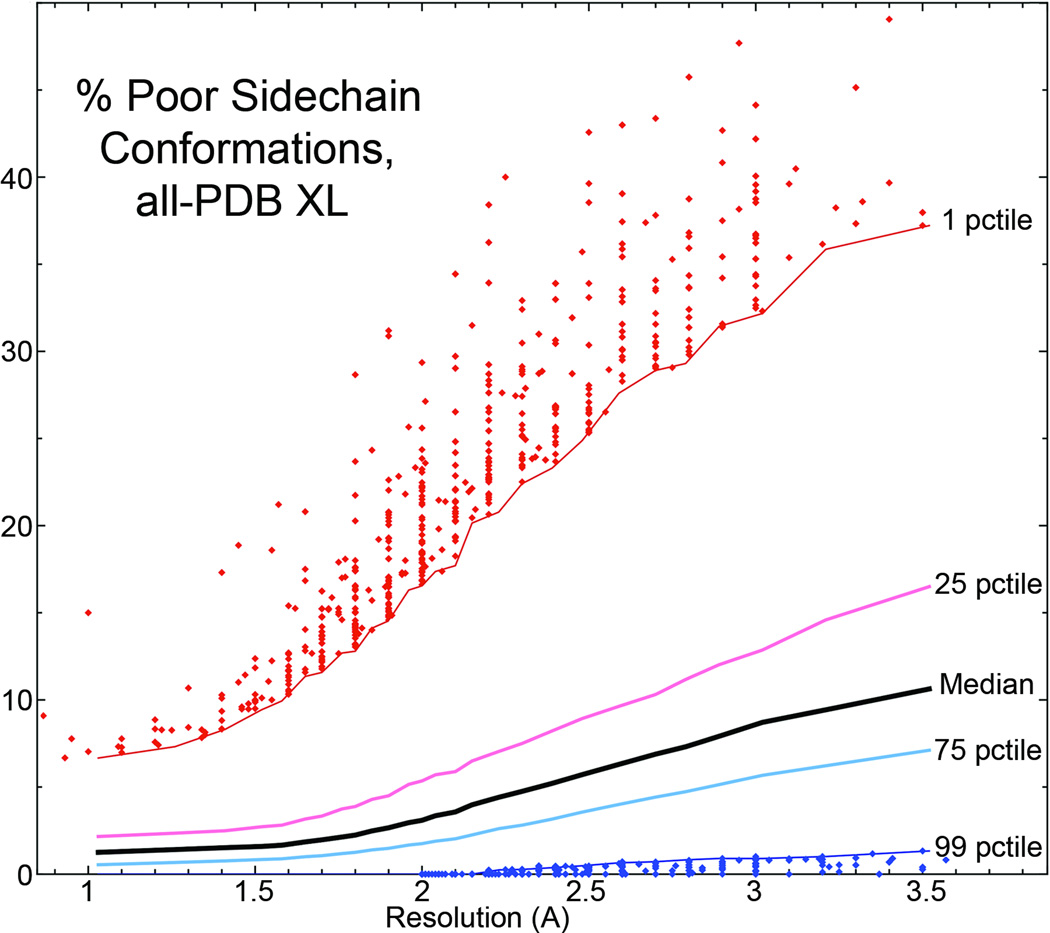
The wwPDB has made two very important recent developments. The first was the mandate requiring deposition of x-ray or NMR data along with coordinates, as of Feb. 1, 2008, which means that structures can be better validated and can be re-refined as methods improve in the future. The second is the wwPDB's project to constitute Validation Task Force committees and to implement their recommendations, first for x-ray crystallography (70) and now also for NMR, SAXS, and cryo-EM (71). The x-ray VTF has recommended a broad but well-tested set of global and local criteria for validating data, model-to-data match, and model quality. Several of the criteria come from MolProbity (clashscore, rotamer, Ramachandran, ribose pucker), but will require modification to match the recommendations. A central feature of the global scores will be per-structure percentile on two systems, one relative to all PDB x-ray entries, and one relative to the structures at similar resolution (70). Figure 13 uses clashscore to show how resolution-dependent percentiles for clashscore are determined from the reference data, with smoothed lines at the quartile and extreme 1st and 99th percentile boundaries. The new VTF system will be used at deposition, summarized on each entry's PDB web page with per-residue and other details available, and a fairly complete summary will be provided for the use of journal referees. Such provision of clearer and more complete validation information at the PDB will make it much easier for end-users to evaluate the quality of structural information, and will probably motivate further efforts at accuracy on the part of depositors, who can now take advantage of better tools than previously available.
Figure 13.
A representation of how resolution-dependent percentiles of the type recommended by the wwPDB X-ray Validation Task Force (69) are determined from the reference data, in this case for all-atom clashscore. Smoothed lines show the derived median, quartiles and extreme 99th (good) and 1st (bad) percentiles. For clarity, individual-entry scores are plotted only outside those extremes.
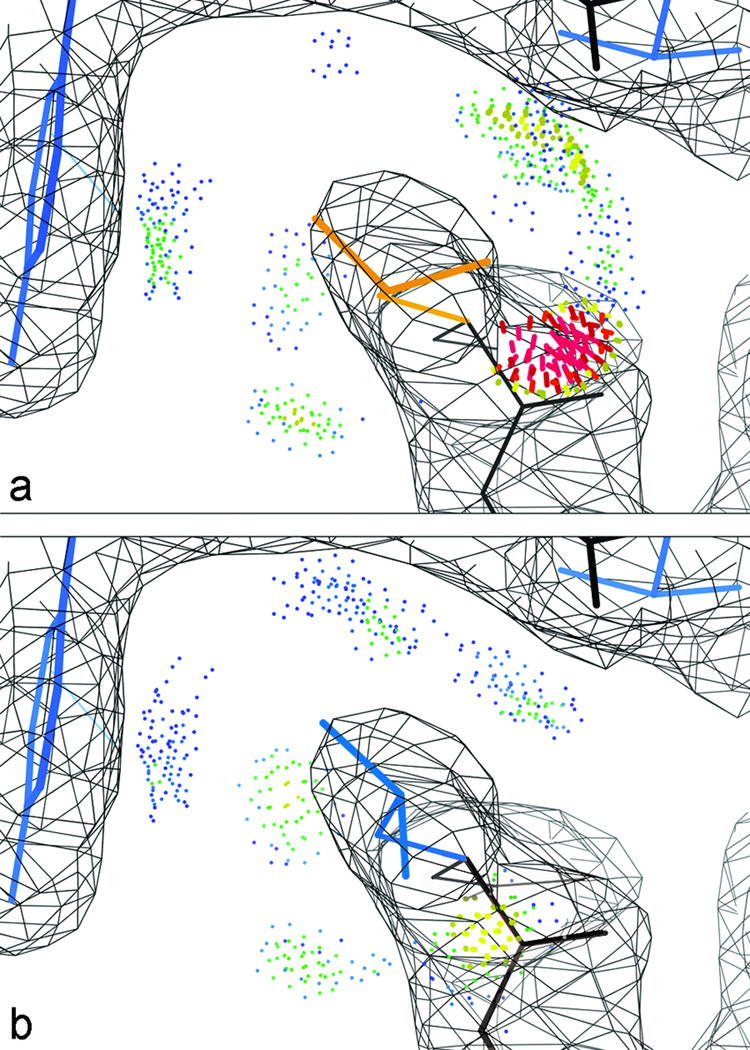
Diagnosing problems by structure validation is useful, but what really motivates us is being able to cure the problems. All-atom contacts have proven very effective at that, because they are local and directional, so they usually give good clues about what needs to move in what direction. They are the basis for the correction of Asn/Gln/His 180° flips done automatically for the user in MolProbity, and they can be displayed interactively in KiNG and in Coot (65) as an important guide for manual rebuilding. A frequently encountered, but usually satisfyingly correctable, systematic error is backward fit of a Cβ-branched or Cγ-branched sidechain (Thr, Val, Ile, Leu); the rebuild needs to consider both all-atom contacts and density fit. Figure 14 illustrates an example, for a backward-fit "decoy" rotamer of a branched-Cγ Leu. It should be kept in mind, however, that although the great majority of rotamer or Ramachandran outliers are mistakes, a few of them are valid conformations held in an unfavorable conformation by hydrogen bonds or local packing; those cases are often at active or binding sites and apt to be interesting.
Figure 14.
Rebuilding a clash and rotamer outlier in KiNG, Leu 60 of 1CX0, which tops the rotamer-sorted chart in Figure 11 and is visible above the helix at lower left in Figure 10b. a) as deposited; b) rebuilt in a good rotamer, with much better all-atom contacts and an equally good fit to density.
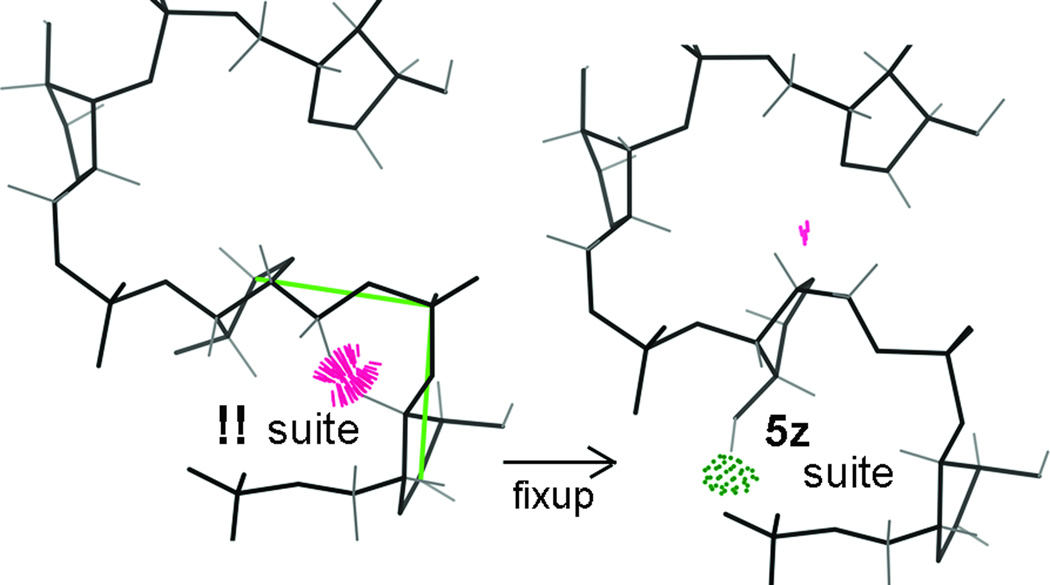
The first, traditional, use of validation was applying it as a final sanity check before deposition. The second stage is to use it often during the process of structure solution, and try rebuilding the outliers manually. The third stage is to automate such diagnosis and correction. We undertook stage 2 at production level in a collaboration with Wolfram Tempel and B.-C. Wang at the SouthEast Collaboratory for Structural Genomics, rebuilding 30 of the SECSG structures as part of their high-throughput pipeline (72). We found that all major model criteria could routinely be improved 5- to 10-fold over control cases or typical PDB entries, with modest but consistent improvements in R and Rfree (73). One of the largest and lowest-resolution of the 30, 1XK8 (78) at 2.7A with a MolProbity score of 1.36 (100th percentile), is shown in Figure 7 above. What we learned in that process was applied to improving the MolProbity service (64), and is currently enabling stage 3 automation in the Phenix software project (69), such as pucker-specific refinement targets for RNA and the ability to autofit rotamer outliers in phenix.refine. As another learning exercise with significant biological fringe benefits, we work on improving both RNA and proteins in ribosome structures (74); a simple example of an rRNA backbone correction is shown in Figure 15. This suite, that starts the S motif in the ribosomal 5S RNA,was a clear outlier both in all-atom clashes (cluster of red spikes) and in the consensus RNA backbone conformer system (marked as !!). It has been successfully rebuilt both manually in Mage and by the automated RNABC system (75). Our current research emphasis is to broaden the benefits of model improvement to difficult crystal structures - to RNA, to multiple conformations at high resolution, and especially to large low-resolution structures and complexes.
Figure 15.
Correction of an RNA clash and backbone-conformer outlier. Suite 77 of the archaeal 5S RNA (82; 1S72 and other Haloarcula marismortui 50S ribosomal structures) has an all-atom steric clash of >1.0Å overlap and is a suite-conformer outlier (!!). When corrected to a 5z conformer it gains a backbone H-bond (green dots), fits the density a bit better, and matches the usual S-motif conformer string of 1a,5z,4s,#a,1a (44).
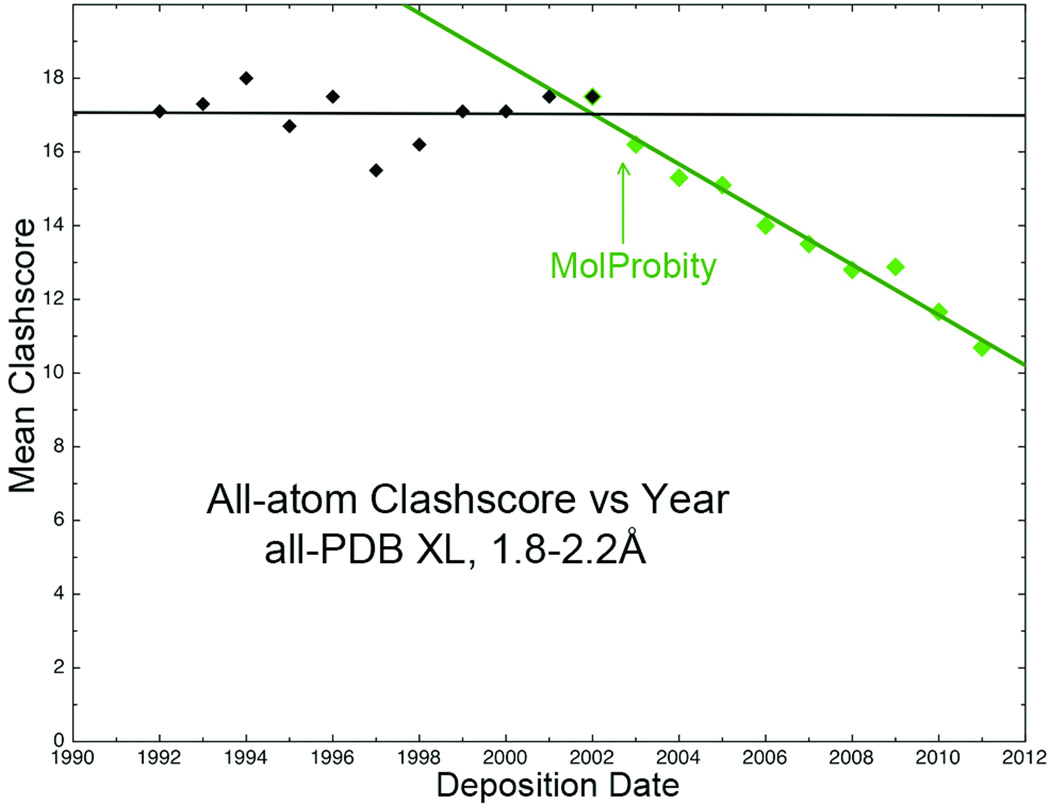
Overall, the use of MolProbity has continued to grow exponentially, and it is now generaly accepted as state-of-the-art for macromolecular crystal structure validation. The most gratifying aspect for us has been seeing an impact on model quality for worldwide depositions to the PDB. Figure 16 plots all-atom clashscore vs year for new depositions to the PDB. All-atom contacts (and also Reduce's Asn/Gln/His flips), are still unique to the MolProbity site or to adoption in other systems such as Coot, PSVS (76) and Phenix. Both those scores were constant before the introduction of MolProbity in 2002, but have improved by about 30% since then (64). We feel, therefore, that we have helped the PDB, in return for all it has done for our research over the years.
Figure 16.
Plot of all-atom clashscore (atomic overlaps ≥0.4Å per thousand atoms) vs year for all crystal-structure PDB depositions in the populous middle resolution range, 1992–2011. Scores were constant before all-atom contact criteria became available, and have steadily improved since (64).
Acknowledgments
This research was funded for the first 34 years at Duke primarily by NIH grant GM15000, and most recently by GM073930 and GM073919. We thank Chris Anfinsen, Fred Richards, and Fred Brooks for their positive influence on our work and lives, our many collaborators and all the wonderful people who have come through our lab for their numerous contributions to these ideas and results, and the PDB and its depositors for those endlessly fascinating structures.
References
- 1.Cotton FA, Hazen EE, JR, Richardson DC. J Biol Chem. 1966;241:4389–4390. [PubMed] [Google Scholar]
- 2.Richards FM. J Mol Biol. 1968;37:225–230. doi: 10.1016/0022-2836(68)90085-5. [DOI] [PubMed] [Google Scholar]
- 3.Bernstein FC, Koetzle TF, Williams GJB, Meyer EF, Brice MD, Rodgers JR, Kennard O, Shimanouchi T, Tasumi M. J Mol Biol. 1977;112:535–542. doi: 10.1016/s0022-2836(77)80200-3. [DOI] [PubMed] [Google Scholar]
- 4.Berman HM, Westbrook J, Feng Z, Gilliland G, Bhat TN, Weissig H, Shindyalov IN, Bourne PE. Nucleic Acids Res. 2000;28:235–242. doi: 10.1093/nar/28.1.235. [DOI] [PMC free article] [PubMed] [Google Scholar]
- 5.Collins DM, Cotton FA, Hazen EE, Jr, Legg MJ. Proc 4th Ann Harry Steenbock Symp. 1975:317. [Google Scholar]
- 6.Dickerson RE, Takano T, Eisenberg D, Kallai OB, Samson L, Cooper A, Margoliash E. J Biol Chem. 1971;246:1511–1535. [PubMed] [Google Scholar]
- 7.Kendrew JC, Dickerson RE, Strandberg BE, Hart RG, Davies DR, Phillips DC, Shore VC. Nature. 1960;185:422–427. doi: 10.1038/185422a0. [DOI] [PubMed] [Google Scholar]
- 8.Perutz MF, Rossmann MG, Cullis AF, Muirhead H, Will G, North ACT. Nature. 1960;185:416–422. doi: 10.1038/185416a0. [DOI] [PubMed] [Google Scholar]
- 9.Blake CCF, Koenig DF, Mair GA, North ACT, Phillips DC, Sarma VR. Nature. 1965;206:757–761. doi: 10.1038/206757a0. [DOI] [PubMed] [Google Scholar]
- 10.Kartha G, Bello J, Harker D. Nature. 1967;213:862–865. doi: 10.1038/213862a0. [DOI] [PubMed] [Google Scholar]
- 11.Wyckoff HW, Hardman KD, Allewell NM, Inagami T, Johnson LN, Richards FM. J Biol Chem. 1967;242:3984–3988. [PubMed] [Google Scholar]
- 12.Matthews BW, Sigler PB, Henderson R, Blow DM. Nature. 1967;214:652–656. doi: 10.1038/214652a0. [DOI] [PubMed] [Google Scholar]
- 13.Drenth J, Jansonius JN, Koekoek R, Swen HM, Wolthers BG. Nature. 1968;218:929–932. doi: 10.1038/218929a0. [DOI] [PubMed] [Google Scholar]
- 14.Lipscomb WN, Hartsuck JA, Reeke GN, Quiocho FA, Bethge PA, Ludwig ML, Steitz TA, Muirhead H, Coppola JC. Brookhaven Symp Biol. 1968;21:24–90. [PubMed] [Google Scholar]
- 15.Wright CS, Alden RA, Kraut J. Nature. 1969;221:235–242. doi: 10.1038/221235a0. [DOI] [PubMed] [Google Scholar]
- 16.Adams MJ, Ford GC, Koekoek R, Lentz PJ, Jr, McPherson A, Jr, Rossmann MG, Smiley IE, Schevitz RW, Wonacott AJ. Nature. 1970;227:1098–1103. doi: 10.1038/2271098a0. [DOI] [PubMed] [Google Scholar]
- 17.Huber R, Kukla D, Ruehlman A, Epp O, Formanek H. Naturwiss. 1970;57:389–392. doi: 10.1007/BF00599976. [DOI] [PubMed] [Google Scholar]
- 18.Herriott JR, Sieker LC, Jensen LH. J Mol Biol. 1970;50:391–406. doi: 10.1016/0022-2836(70)90200-7. [DOI] [PubMed] [Google Scholar]
- 19.Arnone A, Bier CJ, Cotton FA, Day VW, Hazen EE, Jr, Richardson DC, Richardson JS, Yonath A. J Biol Chem. 1971;246:2302–2316. [PubMed] [Google Scholar]
- 20.Cotton FA, Bier CJ, Day VW, Hazen EE, Jr, Larsen S. Cold Spring Harb Symp Quant Biol. 1972;71:243–248. doi: 10.1101/sqb.1972.036.01.032. [DOI] [PubMed] [Google Scholar]
- 21.Anfinsen CB, Schechter AN, Taniuchi H. Cold Spring Harb Symp Quant Biol. 1972;71:249–255. [PubMed] [Google Scholar]
- 22.Jardetsky O, Thielmann H, Arata Y, Markley JL, Williams MN. Cold Spring Harb Symp Quant Biol. 1972;71:257–261. doi: 10.1101/sqb.1972.036.01.034. [DOI] [PubMed] [Google Scholar]
- 23.McCord JM, Fridovich I. J Biol Chem. 1969;244:6049–6055. [PubMed] [Google Scholar]
- 24.Steinman HM, Hill RL. Proc Nat Acad Sci USA. 1973;70:3725–3729. doi: 10.1073/pnas.70.12.3725. [DOI] [PMC free article] [PubMed] [Google Scholar]
- 25.Richardson JS, Thomas KA, Rubin BH, Richardson DC. Proc Nat Acad Sci USA. 1975;72:1349–1352. doi: 10.1073/pnas.72.4.1349. [DOI] [PMC free article] [PubMed] [Google Scholar]
- 26.Richardson JS, Thomas KA, Richardson DC. Biochem Biophys Res Commun. 1975;63:986–992. doi: 10.1016/0006-291x(75)90666-x. [DOI] [PubMed] [Google Scholar]
- 27.Feldman RJ. Rockville MD: Tracor-Jitco Inc; 1976. ISBN 0-917984-01-6. [Google Scholar]
- 28.Rubin BH, Richardson JS. Biopolymers. 1972;11:2381–2385. doi: 10.1002/bip.1972.360111116. [DOI] [PubMed] [Google Scholar]
- 29.Brooks FP., Jr Proc IFIP. 1977:625–634. [Google Scholar]
- 30.Britton EG, Lipscomb JL, Pique ME. Computer Graphics. 1978;12:222–227. [Google Scholar]
- 31.Richardson DC. In: Superoxide and superoxide dismutase. Michelson AM, McCord JM, Fridovich I, editors. Academic Press; NY: 1977. [Google Scholar]
- 32.Tsernoglou D, Petsko GA. Proc Nat Acad Sci. 1977;74:971–974. doi: 10.1073/pnas.74.3.971. [DOI] [PMC free article] [PubMed] [Google Scholar]
- 33.Jones TA. J Applied Crystallogr. 1978;11:268–272. [Google Scholar]
- 34.Hendrickson WA, Konnert JH. Biomolecular Struc Conf Func Evol. 1979;1:43–57. [Google Scholar]
- 35.Tainer JA, Getzoff ED, Beem KM, Richardson JS, Richardson DC. J Mol Biol. 1982;160:181–217. doi: 10.1016/0022-2836(82)90174-7. [DOI] [PubMed] [Google Scholar]
- 36.Richardson JS. Proc Nat Acad Sci USA. 1976;73:2619–2623. doi: 10.1073/pnas.73.8.2619. [DOI] [PMC free article] [PubMed] [Google Scholar]
- 37.Sternberg MJE, Thornton JM. J Mol Biol. 1976;105:367–382. doi: 10.1016/0022-2836(76)90099-1. [DOI] [PubMed] [Google Scholar]
- 38.Richardson JS, Richardson DC, Thomas KA, Silverton EW, Davies DR. J Mol Biol. 1976;102:221–235. doi: 10.1016/s0022-2836(76)80050-2. [DOI] [PubMed] [Google Scholar]
- 39.Richardson JS. Nature. 1977;268:495–500. doi: 10.1038/268495a0. [DOI] [PubMed] [Google Scholar]
- 40.Richardson JS, Getzoff ED, Richardson DC. Proc Nat Acad Sci USA. 1978;75:2574–2578. doi: 10.1073/pnas.75.6.2574. [DOI] [PMC free article] [PubMed] [Google Scholar]
- 41.Richardson JS, Richardson DC. Science. 1988;240:1648–1652. doi: 10.1126/science.3381086. [DOI] [PubMed] [Google Scholar]
- 42.Hemmingsen JM, Gernert KM, Richardson JS, Richardson DC. Protein Sci. 1994;3:1927–1937. doi: 10.1002/pro.5560031104. [DOI] [PMC free article] [PubMed] [Google Scholar]
- 43.Richardson JS, Richardson DC. Proc Nat Acad Sci USA. 2002;99:2754–2759. doi: 10.1073/pnas.052706099. [DOI] [PMC free article] [PubMed] [Google Scholar]
- 44.Richardson JS, Schneider B, Murray LW, Kapral GJ, Immormino RM, Headd JJ, Richardson DC, Ham D, Hershkovits E, Williams LD, Keating KS, Pyle AM, Micallef D, Westbrook J, Berman HM. RNA. 2008;14:465–481. doi: 10.1261/rna.657708. [DOI] [PMC free article] [PubMed] [Google Scholar]
- 45.Richardson JS. Wyckoff, Hirs, Timasheff . Diffraction Methods for Biological Macromolecules. Vol. 115. Methods in Enzymology; 1985. pp. 359–380. [DOI] [PubMed] [Google Scholar]
- 46.Richardson JS. Nature Struct Biol. 1985;7:624–625. doi: 10.1038/77912. [DOI] [PubMed] [Google Scholar]
- 47.Richardson JS. Adv Protein Chem. 1981;34:167–339. doi: 10.1016/s0065-3233(08)60520-3. [DOI] [PubMed] [Google Scholar]
- 48.Carson M, Bugg CE. J Molec Graphics. 1986;4:121–122. [Google Scholar]
- 49.Richardson DC, Richardson JS. Protein Sci. 1992;1:3–9. doi: 10.1002/pro.5560010102. [DOI] [PMC free article] [PubMed] [Google Scholar]
- 50.Davis IW, Murray LW, Richardson JS, Richardson DC. Nucleic Acid Res. 2004;32:W615–W619. doi: 10.1093/nar/gkh398. [DOI] [PMC free article] [PubMed] [Google Scholar]
- 51.Chen VB, Davis IW, Richardson DC. Protein Science. 2009;18:2403–2409. doi: 10.1002/pro.250. [DOI] [PMC free article] [PubMed] [Google Scholar]
- 52.Willighagen E, Howard M. Nature Preceedings. 2007 [Google Scholar]
- 53.Pettersen EF, Goddard TD, Huang CC, Couch GS, Greenblatt DM, Meng EC, Ferrin TE. J Comput Chem. 2004;25:1605–1612. doi: 10.1002/jcc.20084. [DOI] [PubMed] [Google Scholar]
- 54.Richardson DC, Richardson JS. Biochem Mol Biol Educ. 2002;30:21–26. [Google Scholar]
- 55.Ponder JW, Richards FM. J Mol Biol. 1987;193:775–791. doi: 10.1016/0022-2836(87)90358-5. [DOI] [PubMed] [Google Scholar]
- 56.Laskowski RA, MacArthur MW, Moss DS, Thornton JM. J Appl Crystallogr. 1993;26:283–291. [Google Scholar]
- 57.Hooft RWW, Vriend G, Sander C, Abola EE. Nature. 1996;381:272. doi: 10.1038/381272a0. [DOI] [PubMed] [Google Scholar]
- 58.Brunger AT. Nature. 1992;355:472–475. doi: 10.1038/355472a0. [DOI] [PubMed] [Google Scholar]
- 59.Erickson BW, Daniels SB, Reddy PA, Unson CG, Richardson JS, Richardson DC. Computer Graphics and Molecular Modeling. Cold Spring Harbor Press; 1986. pp. 53–57. [Google Scholar]
- 60.Hecht MH, Ogden RM, Richardson JS, Richardson DC. Science. 1990;249:884–891. doi: 10.1126/science.2392678. [DOI] [PubMed] [Google Scholar]
- 61.Richardson JS, Richardson DC, Tweedy NB, Gernert KM, Quinn TP, Hecht MH, Erickson BW, Yan Y, McClain RD, Donlan ME, Surles MC. Biophys J. 1992;63:1186–1209. [PMC free article] [PubMed] [Google Scholar]
- 62.Word JM, Lovell SC, Richardson JS, Richardson DC. J Mol Biol. 1999;285:1735–1747. doi: 10.1006/jmbi.1998.2401. [DOI] [PubMed] [Google Scholar]
- 63.Word JM, Lovell SC, LaBean TH, Zalis ME, Presley BK, Richardson JS, Richardson DC. J Mol Biol. 1999;285:1711–1733. doi: 10.1006/jmbi.1998.2400. [DOI] [PubMed] [Google Scholar]
- 64.Chen VB, Arendall WB, III, Headd JJ, Keedy DA, Immormino RM, Kapral GJ, Murray LW, Richardson JS, Richardson DC. Acta Crystallogr. 2010;D 66:12–21. doi: 10.1107/S0907444909042073. [DOI] [PMC free article] [PubMed] [Google Scholar]
- 65.Emsley P, Lohkamp B, Scott WG, Cowtan K. Acta Crystallogr. 2010;D66:486–501. doi: 10.1107/S0907444910007493. [DOI] [PMC free article] [PubMed] [Google Scholar]
- 66.Lovell SC, Word JM, Richardson JS, Richardson DC. Proteins: Struc Func Genet. 2000;40:389–408. [PubMed] [Google Scholar]
- 67.Lovell SC, Davis IW, Arendall WB, III, de Bakker PIW, Word JM, Prisant MG, Richardson JS, Richardson DC. Proteins: Struc Func Genet. 2003;50:437–450. doi: 10.1002/prot.10286. [DOI] [PubMed] [Google Scholar]
- 68.Murray LJW, Arendall WB, III, Richardson DC, Richardson JS. Proc Nat Acad Sci USA. 2003;100:13904–13909. doi: 10.1073/pnas.1835769100. [DOI] [PMC free article] [PubMed] [Google Scholar]
- 69.Adams PD, Afonine PV, Bunkoczi G, Chen VB, Davis IW, Echols N, Headd JJ, Hung L-W, Kapral GJ, Grosse-Kunstleve RW, McCoy AJ, Moriarty NW, Oeffner R, Read RJ, Richardson DC, Richardson JS, Terwilliger TC. Acta Crystallogr. 2010;D 66:213–221. doi: 10.1107/S0907444909052925. [DOI] [PMC free article] [PubMed] [Google Scholar]
- 70.Read RJ, Adams PD, Arendall WB, III, Brunger AT, Emsley P, Joosten RP, Kleywegt GJ, Krissinel EB, Luetteke T, Otwinowski Z, Perrakis A, Richardson JS, Scheffler WH, Smith JL, Tickle IJ, Vriend G, Zwart PH. Structure. 2011;19:1395–1412. doi: 10.1016/j.str.2011.08.006. [DOI] [PMC free article] [PubMed] [Google Scholar]
- 71.Henderson R, Sali A, Baker ML, Carragher B, Devkota B, Downing KH, Egelman EH, Feng Z, Frank J, Grigorieff N, Jiang W, Ludtke SJ, Medalia O, Penczek PA, Rosenthal PB, Rossmann MG, Schmid MF, Schroeder GF, Steven AC, Stokes DL, Westbrook JD, Wriggers W, Yang H, Young J, Berman HM, Chiu W, Kleywegt GJ, Lawson CL. Structure. 2012;20:205–214. doi: 10.1016/j.str.2011.12.014. [DOI] [PMC free article] [PubMed] [Google Scholar]
- 72.Liu ZJ, Tempel W, Ng JD, Lin D, Shah AK, Chen L, Horanyi PS, Habel JE, Kataeva IA, Xu H, Yang H, Chang JC, Huang L, Chang SH, Zhou W, Lee D, Praissman JL, Zhang H, Newton MG, Rose JP, Richardson JS, Richardson DC, Wang B-C. Acta Crystallogr. 2005;D61:679–684. doi: 10.1107/S0907444905013132. [DOI] [PubMed] [Google Scholar]
- 73.Arendall WB, III, Tempel W, Richardson JS, Zhou W, Wang S, Davis IW, Liu Z-J, Rose JP, Carson WM, Luo M, Richardson DC, Wang B-C. J Struct Func Genomics. 2005;6:1–11. doi: 10.1007/s10969-005-3138-4. [DOI] [PubMed] [Google Scholar]
- 74.Dunkle JA, Wang L, Feldman MB, Pulk A, Kapral GJ, Noeske J, Richardson JS, Blanchard SC, Cate JH. D. Science. 2011;332:981–984. doi: 10.1126/science.1202692. [DOI] [PMC free article] [PubMed] [Google Scholar]
- 75.Wang X, Kapral GJ, Murray LW, Richardson DC, Richardson JS. J Math Biol. 2008;56:253–278. doi: 10.1007/s00285-007-0082-x. [DOI] [PMC free article] [PubMed] [Google Scholar]
- 76.Bhattacharya A, Tejero R, Montelione GT. Proteins: Struc Func Bioinf. 2005;66:778–795. doi: 10.1002/prot.21165. [DOI] [PubMed] [Google Scholar]
- 77.Banner DW, Bloomer A, Petsko GA, Phillips DC, Wilson IA. Biochem Biophys Res Commun. 1976;72:146–155. doi: 10.1016/0006-291x(76)90972-4. [DOI] [PubMed] [Google Scholar]
- 78.Tempel W, Chen L, Liu Z-J, Lee D, Shah A, Dailey TA, Mayer MR, Arendall WB, III, Rose JP, Dailey HA, Richardson JS, Richardson DC, Wang B-C. deposited but unpublished, SECSG. [Google Scholar]
- 79.Park S-Y, Yokoyama T, Shibayama N, Shiro Y, Tame JR. J Mol Biol. 2006;360:690–701. doi: 10.1016/j.jmb.2006.05.036. [DOI] [PubMed] [Google Scholar]
- 80.Charles P, Sundaresan S, Palani K, Neeelagandan K, Ponnuswamy MN. deposited but unpublished. [Google Scholar]
- 81.Ferre-D'Amare AR, Zhou K, Doudna JA. Nature. 1998;395:567–574. doi: 10.1038/26912. [DOI] [PubMed] [Google Scholar]
- 82.Klein DJ, Moore PB, Steitz TA. J Mol Biol. 2004;340:141–177. doi: 10.1016/j.jmb.2004.03.076. [DOI] [PubMed] [Google Scholar]


