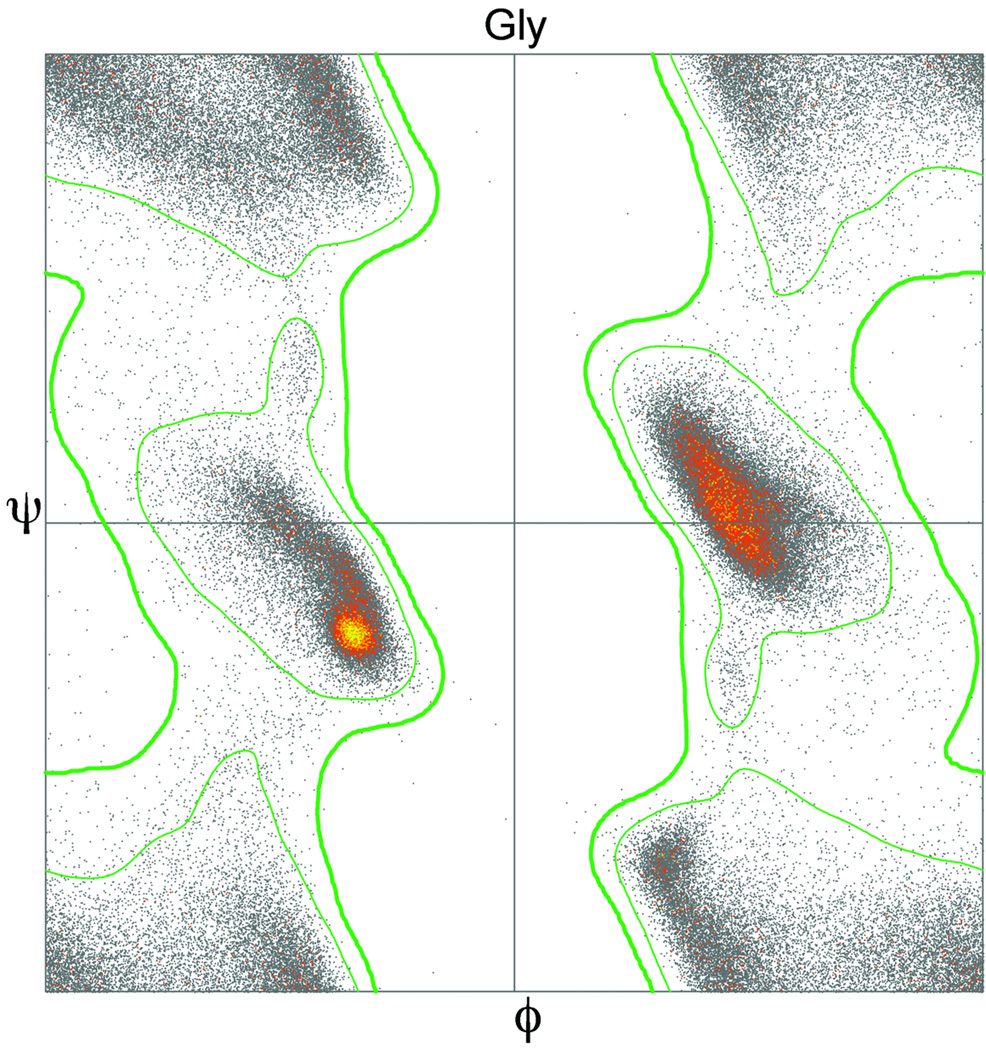
Figure 12.
Ramachandran plot for the 116,789 glycine residues with B-factor ≤30 in the Top8000 dataset of protein chains, color-coded by the number of datapoints in each 0.1° ϕ,ψ bin. Inner contour (symmetrized) encloses 98% of this quality-filtered data (favored region) and outer contour encloses 99.9% and excludes 0.1% of the data (the Ramachandran outliers for Gly).

