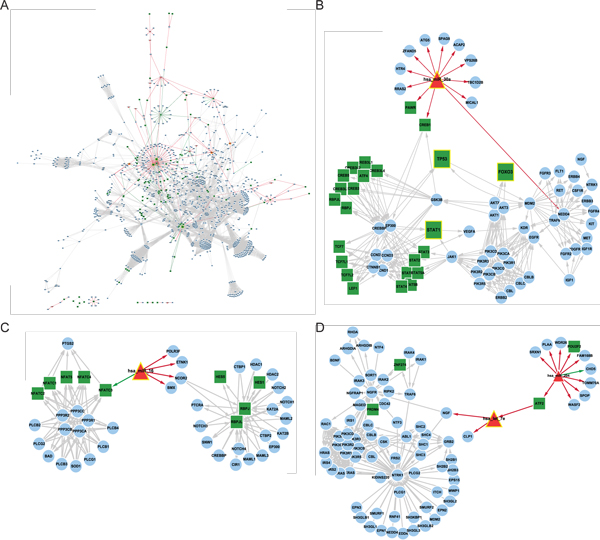
Figure 4.
Differential regulatory network and key miRNA regulators of HCC metastasis. (A). Differential regulatory network of the 17 classifying modules and their enriched pathways. The green edges represent edges whose CLR weights are larger in network of non-metastasis, while the orange ones represent edges whose weights are larger in network of metastasis. The color and shape of the nodes represent the type of "genes": TF in green rectangle, miRNA in red triangle, and gene in blue eclipse. Six regulators of which modules were enriched in KEGG non-metabolic pathways are highlighted in nodes with larger size and yellow border (hsa-miR-16, hsa-miR-30a, hsa-let-7e, STAT1, TP53, FOXO3). The graph structure of KEGG pathways embodied by gene(protein)-gene(protein) interactions was retrieved by the R package KEGGgraph. (B). Differential regulatory network of miR-30a. (C). Differential regulatory network of miR-16. (D). Differential regulatory network of let-7e/miR-204.

