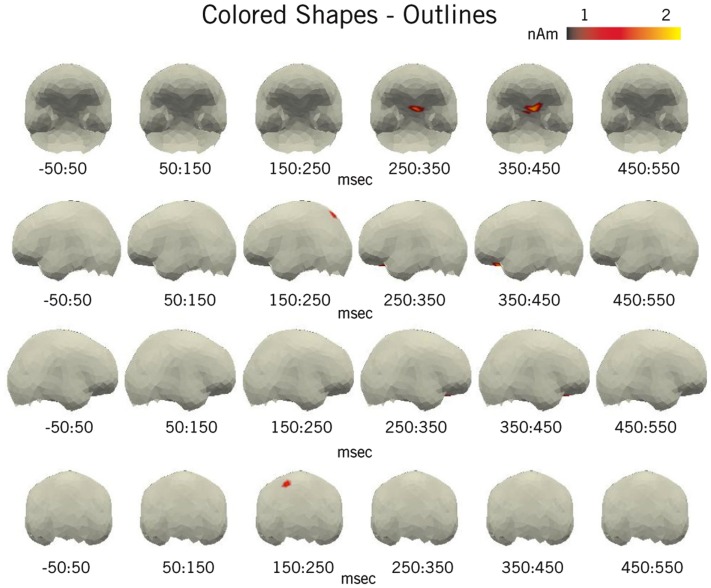
Figure 4.
Pictorial full-brain results. Plotted regions denote the difference in average amplitude between the Colored Shape and Outline conditions for all space-time regions in which Colored Shape activity was reliably greater than Outline activity (by at least 1 nAm and p < 0.05, paired samples t-test) for at least 5 ms over five spatial neighbors. For clarity, non-cortical sources have been removed. Results conform to our ROI analysis and show a clear vmPFC effect at ∼400 ms. An additional increase in activity generated during the Colored Shape condition can be seen in the superior parietal cortex at ∼200 ms.

