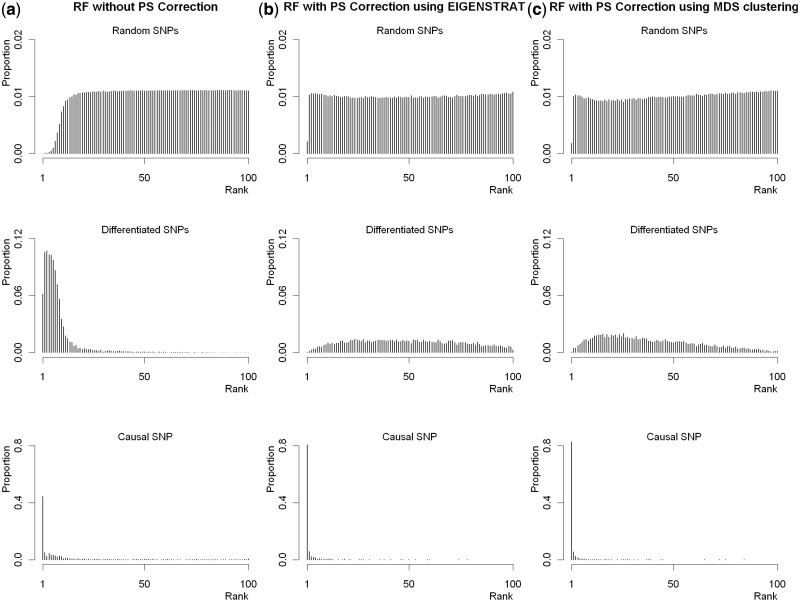
Figure 1.
Distributions of ranks of the three types of SNPs from Scenario 1 with moderate population stratification. The plots in panel (a) provide the distributions of ranks of VIMs from RF without PC correction. The plots in panels (b) and (c) give the distributions from RF with PS correction based on EIGENSTRAT and MDS clustering, respectively. In each plot, the x-axis is the rank of VIMs, ranging from 1 to 100, with 1 denoting ‘the most important’. The y-axis is the proportion of SNPs with rank equal to the coordinator in the x-axis

