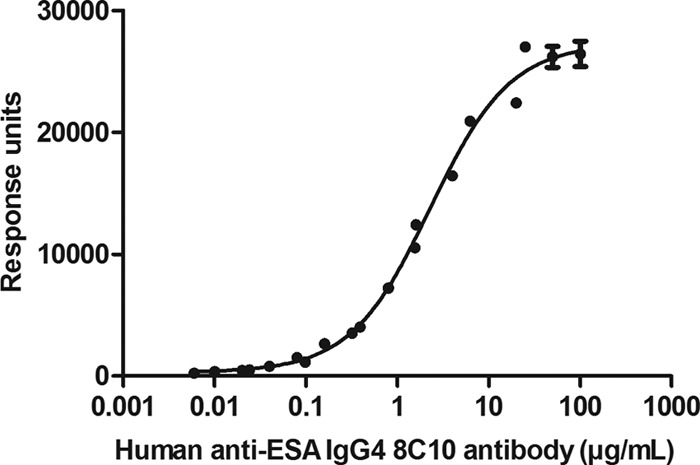
Fig 1.

Graph representing the signal (in response units) relative to the PNHS spiked with 0.0025 to 100 μg/ml of human anti-ESA antibody 8C10G4. A total of 13 curves were analyzed in duplicate. The graph was constructed using a 4-parameter logistic nonlinear regression model in GraphPad Prism v. 5.0. The response unit per concentration is reported with the standard error of the mean (SEM).
