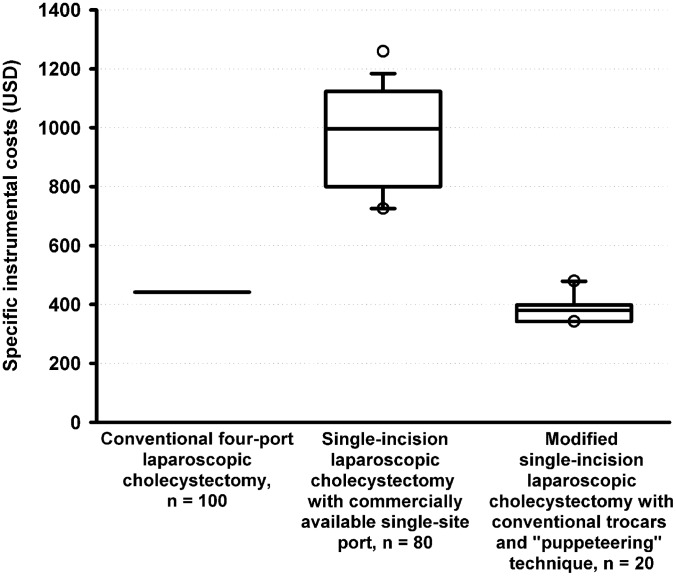
Figure 4.
Box-Whisker plot of instrumental costs specific for each of the 3 surgical techniques assessed. Horizontal lines, boxes, bars, and circles indicate median, 25 to 75 percentile range, 5 to 95 percentile range and outlier values, respectively. All groups were mutually significantly different: P < .0005.

