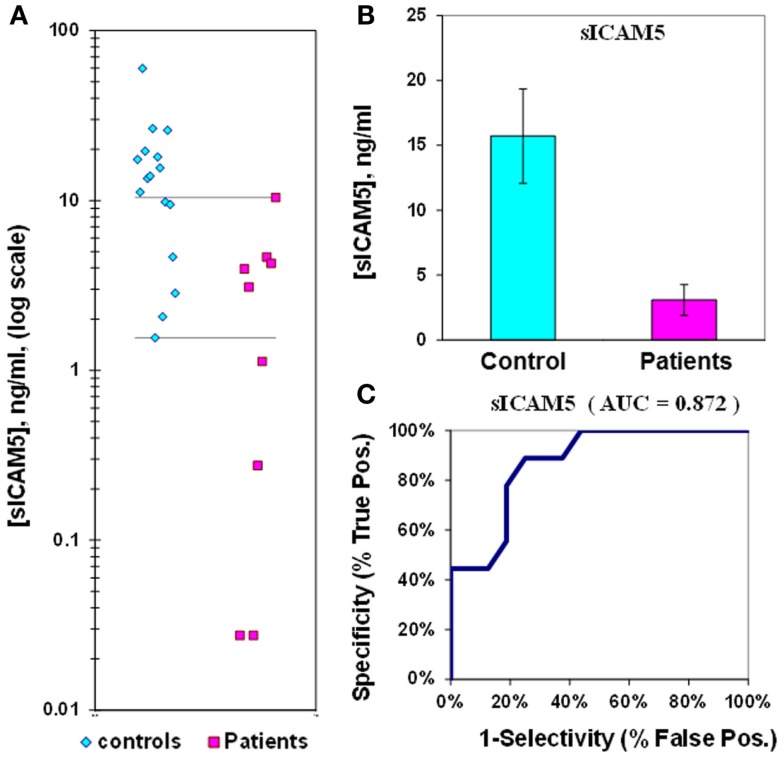
Figure 1.
Assay of sICAM5 in plasma from epilepsy patients and controls. (A) Dot-plot of sICAM5 concentrations in plasma (square, patients; diamond, controls). For values between the horizontal lines, the assay does not accurately discriminate between patients and controls. (B) Bar graph and error calculation for data in Part (A). Difference is significant for p = 0.002. (C) ROC curve for data in Part a, showing an area under the curve (AUC) value of 0.87.

