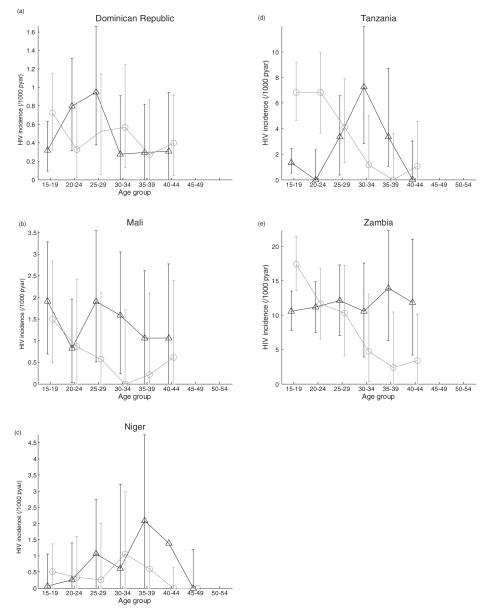
Fig. 1. Estimates of HIV incidence.
Estimates are for men (triangles) and women (circles) per 1000 person-years at risk. Error bars shows 95% bootstrap intervals; bars approaching the zero line indicate that the observed change in prevalence can be completely ascribed due mortality. Note the differences in the scales of the vertical axes.

