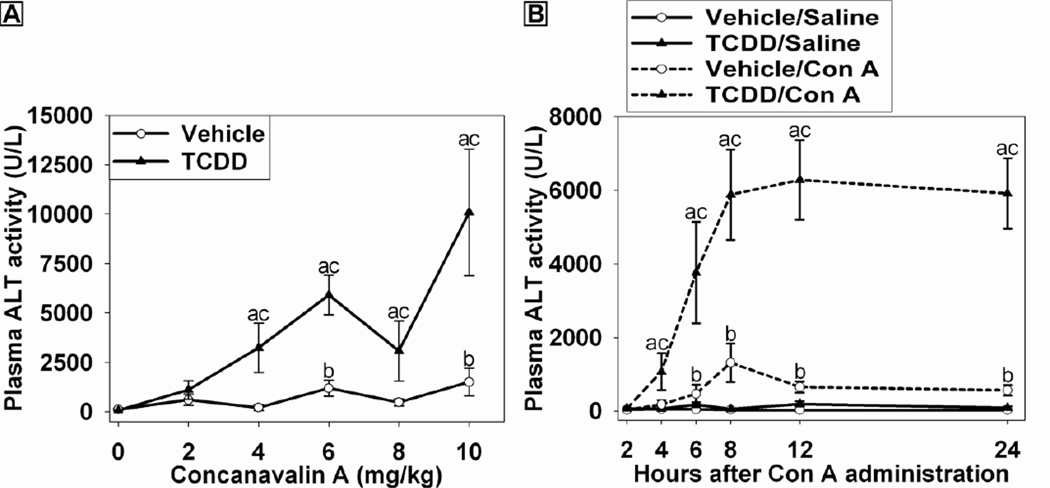
Figure 1. Dose-response and time course of Con A-induced liver injury in the presence and absence of TCDD.
(A) Mice were treated on Day 0 with either 30 µg/kg TCDD or vehicle. Four days later mice received Con A at doses from 0-10 mg/kg. ALT activity in plasma was measured 24 h after Con A administration. a p < 0.05 TCDD/Con A versus TCDD/Saline. b p < 0.05 Vehicle/Con A versus Vehicle/Saline. c p < 0.05 TCDD/Con A versus Vehicle/Con A at the same dose. Data represent the mean ± SE of independent replicates from 2 separate experiments. At each dose: Vehicle/Con A n=3–5 and TCDD/Con A n=3–5.
(B) Mice were treated with vehicle (open circle) or 30 µg/kg TCDD (black triangle) on day 0. On day 4, pretreated mice were administered saline (solid line) or 6 mg/kg Con A (dashed line). Plasma was collected at the times indicated, and ALT activity was determined. a p < 0.05 TCDD/Con A versus TCDD/Saline at the same time point. b p < 0.05 Vehicle/Con A versus Vehicle/Saline at the same time point. c p < 0.05 TCDD/Con A versus Vehicle/Con A at the same time point. Data represent the mean ± SE of independent replicates from 2 separate experiments. At each time point: Vehicle/Saline n=4–5, TCDD/Saline n=4–5, Vehicle/Con A n=5–9, and TCDD/Con A n=5–9.

