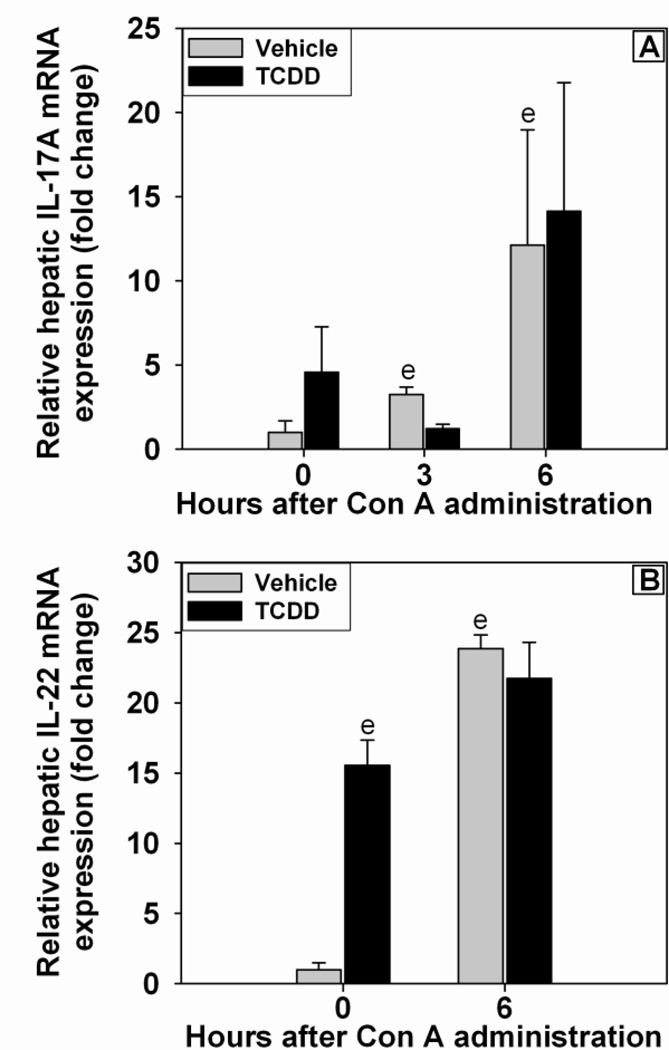
Figure 4. Expression of IL-17A (A) and IL-22 (B) mRNA in liver after Con A administration.
Mice were treated as described in the legend to Figure 2 with Vehicle/Con A (grey bars) or TCDD/Con A (black bars). e p < 0.05 versus Vehicle treatment at 0 h. Data represent the mean ± SE of independent replicates from 2 separate experiments. At each time point: Vehicle/Con A n=4–6 and TCDD/Con A n=4–6.

