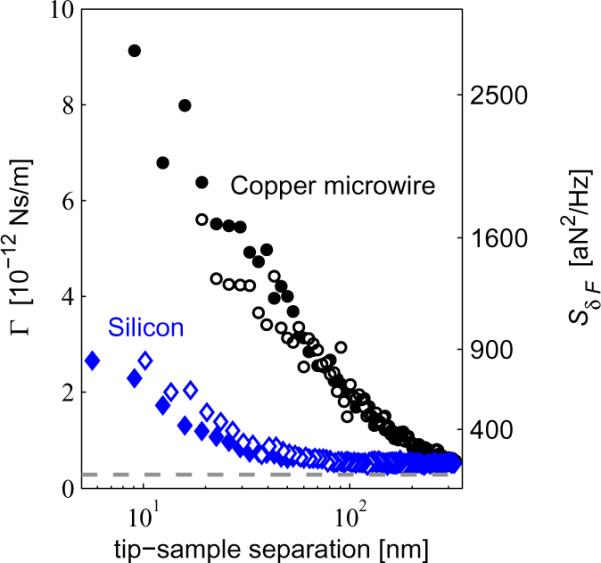
Figure 6.

Cantilever dissipation G (left axis) versus tip-sample separation, and the corresponding spectral density of force fluctuations SδF at T = 5.5K (right axis). Dissipation is shown for the tip centered over the copper microwire (black circles) and over the silicon substrate (blue diamonds). Measurements were conducted at Bext = 2.63 T (closed circles and diamonds) and at zero field (open circles and diamonds). The dotted gray line is the cantilever's internal dissipation, calculated from the cantilever fc, k, and Q measured far away from the surface.
