
Figure 4.
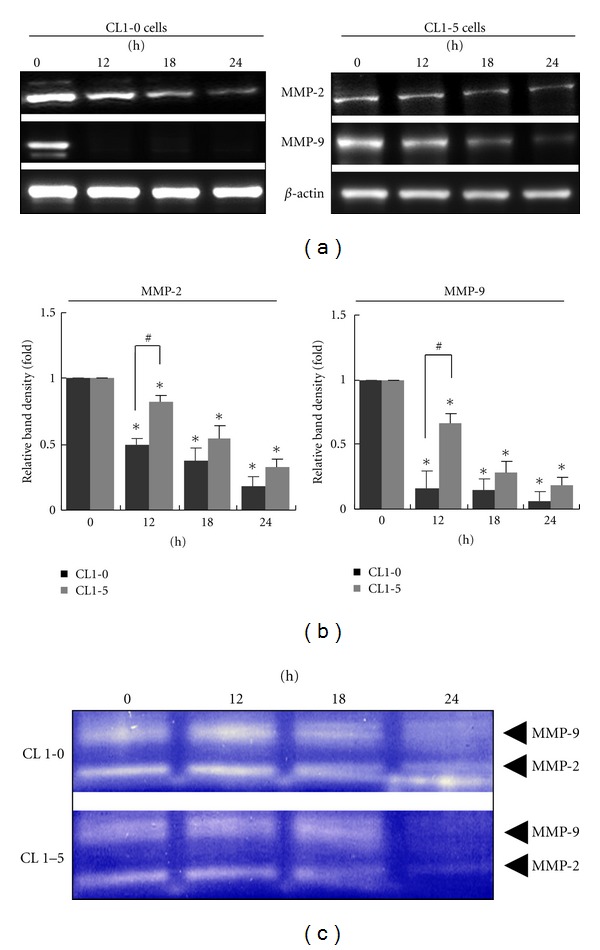
MMPs activities in MCME-treated CL1-0 and CL1-5 cells. (a) Expression of MMP2 and MMP9 in MCME-treated CL1-0 and CL1-5 cells. Expression of MMP-2 and MMP-9 was decreased after treating with MCME at 1.25 mg/mL. (b) Quantified expression of proteins in MCME-treated CL1 cells. The protein expression levels were normalized to β-actin and expressed as the fold-change to the respective control (0 h). Data derived from three independent experiments were represented by mean ± SEM. * indicates a significant difference of P < 0.01 as compared with control groups, whereas # indicates P < 0.05 between two groups. (c) The enzymatic activities of MMP-2 and MMP-9 of CL1-0 and CL1-5 cells treated with MCME at 1.25 mg/mL. The MMP activities in cultured media were determined by gelatin zymography and identified by clear zones of digested gelatin.