Fig 1.
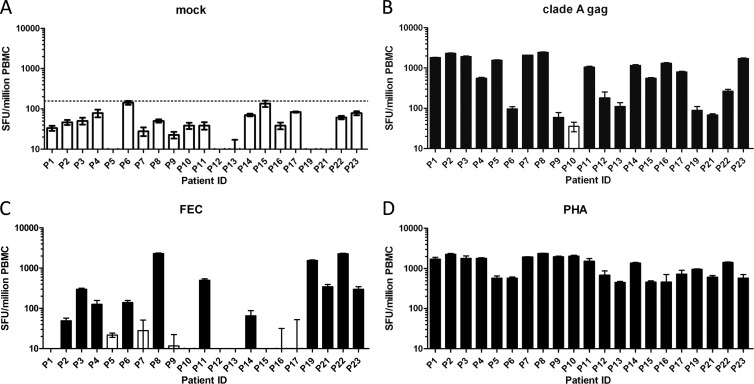
IFN-γ ELISPOT responses for 21 treatment-naïve HIV-infected individuals living in Guinea-Bissau. SFU counts for each patient in response to the indicated stimuli are presented per million PBMC. (A) Mock responses to 0.2% dimethyl sulfoxide (DMSO). Each bar represents the mean of six responses observed for each donor. Error bars denote the standard errors of the means. The dotted line indicates an arbitrary cutoff value of 157 SFU per million PBMC. (B) Responses to overlapping clade A Gag peptides. (C) Responses to FEC peptides. (D) Responses to the PHA positive control. SFU counts in panels B to D were determined after subtracting background (mock) values from the mean of triplicate responses observed for each donor. Black bars denote responses that scored positive using the DFR(eq) statistical test criteria. White bars denote responses that scored negative.

