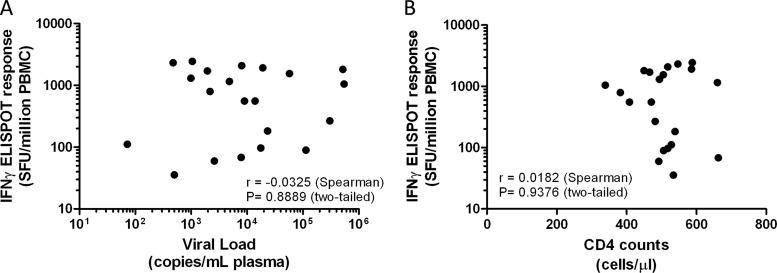
Fig 2.
The magnitude of IFN-γ ELISPOT responses does not correlate with either the viral load or CD4T cell counts. Each dot represents the mean of triplicate ELISPOT responses observed against clade A Gag peptides for each patient, plotted against the observed viral load (A) or CD4 T cell count (B) determined at the time of sample collection. Correlation analysis was performed using the nonparametric Spearman's rank correlation test.

