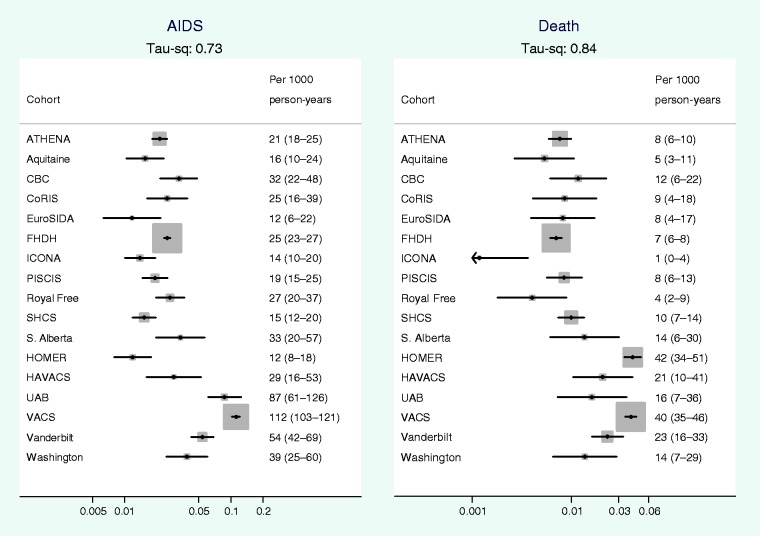
Figure 1.
Crude rates (per 1000 person-years) of AIDS and all cause mortality by cohort, average rate estimated during the period from 31 days to 2 years after start of ART. The size of the squares represents the weight assigned to each study in the meta-analysis and is proportional to the number of events in that study (whiskers show 95% CI). τ2 is the between-cohort variance in the rate

