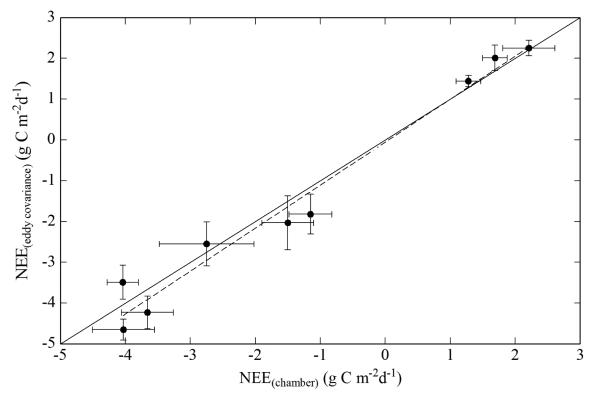
Fig. 1.
Comparison between 7-day average daily integrated net ecosystem exchange of CO2 (NEE; g C m−2 s−1) derived from chamber and eddy covariance data at the valley bottom meadow. The solid line is the 1:1 line, the dotted line corresponds to a linear regression (NEE(eddy covariance) = 1.05 NEE(chamber) − 0.05; R2=0.97). Error bars represent standard errors and reflect temporal variability in gap-filled NEE (eddy covariance) and in meteorological input parameters of light response curve models (Eq. 2), which were used to simulate NEE based on chamber data.

